
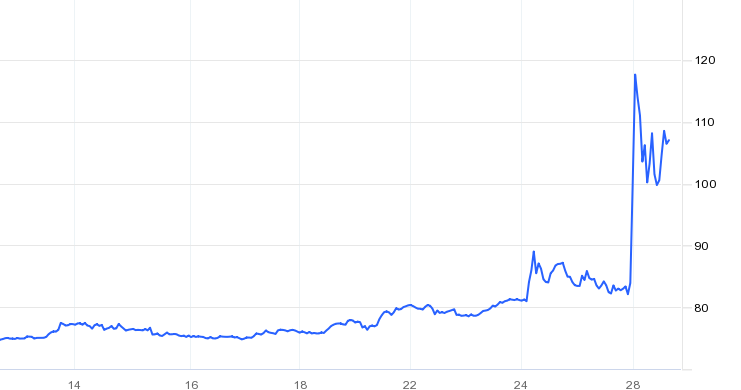
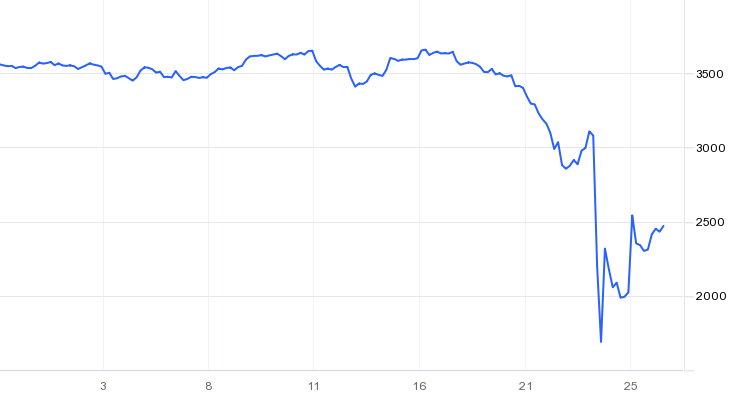
The war in the Ukraine caused by the Russian invasion is the dominant topic around the world. In particular Western states widely underestimated Putin and the likelihood of the Russian invasion. Initial rumours anticipated an invasion from Russia on Monday, 14th February 2022, as Russian troops supposedly retreated. After the invasion did not take place then, there were some signs of relief, which were short-lived. Fears started to grow when Putin acknowledged the separatists in the Eastern Ukraine, more specifically, Donetsk and Luhansk. There were crucial similarities compared to the annexation of the Crimea peninsula in 2014. While this was going on, Western countries threatened Russia with sanctions. Those did not achieve a meaningful impact, as on Thursday morning, the worst case in that situation occurred. Russia invaded the Ukraine from all angles and managed to shutdown their missile defences almost immediately. Russia conquered several parts of the Ukraine extremely quickly and found itself soon on the doors of the capitol, Kyiv. Later that day, sanctions on Russia were imposed by the US, the UK, the G7 states and most other European countries. These included freezing the assets of some of Russian elites, some banks and businesses in the respective countries. This sanctions prohibit being involved in any kind of business with those individuals, banks or businesses. The US also banned individuals from trading Russian sovereign debt. Those sanctions had little impact on the invasion of Russia. Most people hoped the sanctions would be harsher, but at that point Europe was reluctant on banning Russia from SWIFT due to their reliance on Russia’s oil and gas. The invasion truly changed into a war in the city of Kyiv and over time most countries around the world support the Ukraine with additional weapons and ammunition, while some countries even sent soldiers to help defending the country. On Monday, the SWIFT ban from some Russian banks was announced as well as the extension of listed targets and institutions whose assets are frozen. Initially, Russia’s goal was to de-weaponize the country and to replace Zelensky, the prime minister of the Ukraine, by a more pro-Russian government. Russia employed substantial propaganda and legitimized the invasion by calling the Ukraine being full of Nazis among other things. It now seems very questionable whether replacing the government was the initial target, as it feels much more like a full annexation. This puts in particular the Baltic states into a state of alert, as if Putin’s goal to recreate the former Soviet Union, then they are likely the next target. This also explains the harsh threats from Russia when discussions were held whether Finland should become a NATO state. Further unpleasant developments are that China can be considered neutral towards Russia’s actions, as they first supported the Russian invasion given the reasons from Russia. However, they also followed through on Zelensky’s call to talk to Putin on possibilities to resolve this war. After an initial discussion between the Ukraine and Russia was denied by the Ukraine, it seems to be likely that Putin and Zelensky agreed to a meeting. This comes after Russia’s threat of using nuclear warheads. Unsurprisingly, markets reacted with tremendous volatility over the past two weeks. The sanctions on Russia had a detrimental effect on Russia’s economy. The Russian Rubel collapsed by 30% after Western countries announced the SWIFT ban for some Russian banks, after the Rubel has already lost substantially in value since the start of the invasion, as shown in Figure 1. Russia’s equity market also took a huge hit. On the day of the invasion, the MOEX Russia Index dropped by almost 50% from 3,200 down to 1,700. Despite its recovery, it is questionable how Russian equities will perform in the short-term future, as further sanctions are likely and make doing business outside Russia very difficult.
Hedge Funds
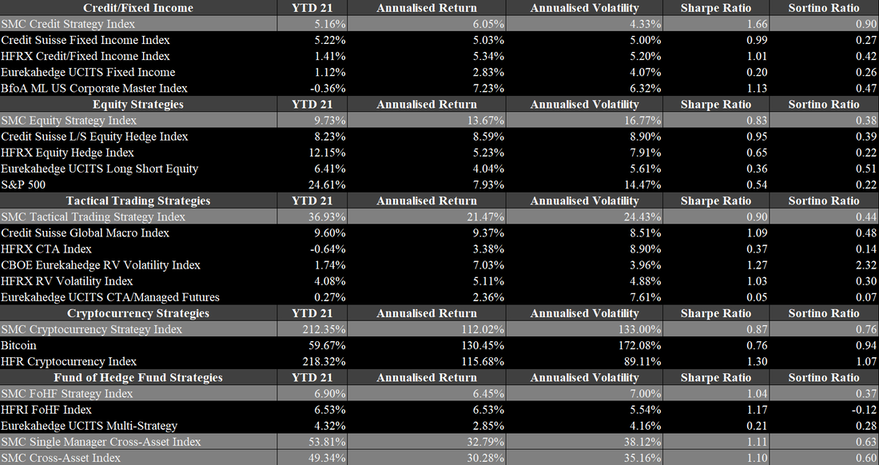
Hedge funds had a great 2021 and managed to set a record high in its AuM. As of the third quarter in 2021, the AuM of the industry is expected to be between $4.3tn and $4.6tn depending on the sources. According to BarclayHedge, the industry’s AuM just surpassed the $4.5tn mark at the end of the third quarter. This is a steep increase from just $3.8tn in 2020, as shown in Figure 6. This is a gain of more than 18% in less than a year. It is expected that the number will rise slightly, once the Q4 2021 numbers are out, as October and November 2021 were rather positive. Nonetheless, December 2021 will have dampened the results of Q4 2021. Generally, the industry has gained substantially over the past ten years, despite a rather inferior view from market participants during most of that period. The AuM soared thanks to two reasons. Firstly, the industry saw substantial capital net inflows. During the first three quarters, the industry received $41bn in fresh capital after having received another $19bn in the second half of 2020. Since then, the industry saw net inflows in every quarter, which is stark break from previous years when the industry experienced net outflows in most quarters. In Q4 2021, net inflows rose to $81bn in 2021, according to Eurekahedge. Figure 7 also shows the severe initial impact of Covid-19 in 2020, when accounting for the significantly positive inflows in the latter half of the year. The second reason for the steep increase in AuM is due to the performance of the hedge fund industry in 2021. Hedge funds in 2021 returned slightly more than 10%, making it the third best year in history after 2020 and 2009 according to HFR. This is remarkable, as the year has not been easy with the constant uncertainty and high volatility in the market. In particular event-driven, equity and commodity strategies have performed very well and the high beta strategies within their respective sector. Figure 8 summarizes the performances of several strategies during 2021 by Eurekahedge. Distressed debt and event-driven strategies performed best with barely any negative performances during the year. Macro and fixed income strategies struggled the most throughout the year, due to the harsh economic conditions. When looking at the highlighted percentiles, it is evident that the high volatility in the market also caused high volatility in hedge fund returns, independent of the strategy. This is most relevant for long short equity strategies whose returns vary between +30% (upper percentile) and -10% (lower percentile) in 2021. Figures 9 to 13 highlight the SMC Strategy Indices in 2021 compared to their benchmarks. The SMC Credit Strategy Index gained slightly more than 5% in 2021, although the variation across strategies is substantial. Two strategies, Trade Finance Crypto and European High Yield L/S Credit did very well in the economic environment, as they reached returns above 12% and 19% in 2021. The Trade Finance Strategy is in particular remarkable, as the strategy has not experienced a negative month since its inception in 2017. The SMC Equity Strategy Index gained closely less than 10%, which is around as much as the average equity strategy in 2021. Within the sector, there was also considerable volatility, due to the sub-strategies. Unsurprisingly, the Equities US Activist Event-Driven performed best with a return exceeding 33%. More tech-focused strategies faced more issues but returned closely below 10% after an extremely successful 2020. Global macro strategies had a tough year and closed only slightly positive for the year. The SMC Global Macro Strategy Index is up almost 37% in 2021, which is largely due to the Discretionary Global Macro Strategy achieving a return of almost 70%. To nobody’s surprise, cryptocurrency strategies performed best in 2021. The SMC Cryptocurrency Strategy Index gained more than 212% in 2021. In the space, it was most important to hold a diversified account of cryptocurrencies to achieve such a great return, as Bitcoin (BTC) gained only 60%. The most successful strategies in the space focused on riskier tokens. The Token and Token Liquid strategies gained 295% and 385% respectively. Despite the great results of 2021, the gains are still inferior to the 342% in 2020. The developments in the crypto space will be discussed in a further paragraph. Lastly, another indicator that the industry is in a healthy state is the fact that the number of launches substantially exceed the liquidations and the number of active funds has reached an all-time high of 22,081. 
Alternative Markets Outlook 2022
2021 was firmly in the grasp of Covid-19 through the Delta and Omicron strain. Although Covid-19 was managed solidly, the imposed restrictions and the economic interventions have severely impacted the economy and society. Not only has inflation skyrocketed but it is also likely to persist for quite some time. In January 2021, the US CPI was at 1.4% and rose to 6.8% in November 2021. In Europe, the situation looks similar, although the initial surge started earlier in the US and currently Europe’s inflation is lower with 4.9% in November 2021. In 2022, inflation will prevail with even higher levels in early 2022 with a realistic chance to subside towards the latter part of 2022. This rather grim outlook is largely in line with the observation during 2021, when inflation targets were mostly too low and the estimated time period were too short. The US will probably experience slightly higher levels, due to the larger extent of money printing to fight Covid-19 originally. Central bank intervention will be reduced to normal levels in the latter part of 2022. It has been already announced that they will scale back their asset buying programs but not entirely. Depending on how Covid-19 is evolving, it seems reasonable that towards the end of 2022, these programs will be discontinued. Aside from these monetary interventions, there were also substantial fiscal interventions, as shown in Figure 1. Figure 1 depicts the US national debt and the increase of additional trillion of debt. Since Covid-19 emerged, six additional trillions were spent to fight the immediate impact. In particular, the speed at which the money was spent is remarkable. While it took between 30 and 300 days for an additional trillion during Covid-19, it took between 170 and 320 days during the global financial crisis in 2008. The measure undertaken to fight Covid-19 are massive but they have helped the economy to bounce back. Among others, the development of the employment is largely desirable. For example, in the US, the unemployment rate was reduced to 4.2% from its peak of more than 14% in 2020. Equity markets, which have contributed in a major fashion to the overall success of 2021, will be largely impacted by Covid-19 in 2022. This was once again observable in November 2021 when Omicron emerged. Assuming a positive development, it is likely that equity markets will keep rising, although at a normal pace below unlike 2020 and 2021. Figure 2 and 3 show the S&P 500 and the Euronext 100 indices over the past two years. Since January 2020, the S&P 500 gained 47.5%, while the Euronext 100 gained 18.9%. The gains since their bottom in March 2020 are 118.4% for the S&P 500 and 86.0% for the Euronext 100. One potential reason for the strong growth in 2020 and 2021 may be due to expected inflation ahead, which is compensated by higher nominal gains. This effect is likely to fade given the enormous growth numbers in 2021 which have given rise to doubts about the sustainability of these profits alongside fears of another financial bubble. This is in particular true for industries that have benefited from Covid-19, such as technology. One example of seemingly unhealthy gain is Tesla, which is up more than 1,000% since Covid-19 emerged. The companies benefiting from Covid-19 should be viewed with caution, while companies that were negatively affected by Covid-19 certainly involve less risk. A negative development with the handling of Covid-19 could turn the situation upside down again and trigger similar effects as in March 2020. This may occur, for example, if a new strain emerges with a substantially increased fatality rate, is spread relatively easily and vaccinations are of only mediocre effectiveness against the new strain. Yet, this scenario is rather unlikely given that with each wave, the number of infections remains at a relatively similar level, while hospitalizations and fatalities decline. Furthermore, virus strains that spread more easily, such as Omicron, frequently are less deadly. These two observations favour the good scenario going forward. In an environment of high volatility and many opportunities, alternative assets are well positioned. Figure 4 highlights the volatility in the market measured by the VIX. Since the occurrence of Covid-19, the volatility in markets has never reached levels prior to Covid-19, although there has been a massive improvement. From the peak in March 2020 and a level of more than 80, markets have stabilized between 15 and 25 in quiet times with occasional spikes. With regards to alternative assets, 2020 and 2021 were highly beneficial for several reasons. Firstly, in crises, actively managed vehicles are of increased interest as they try to mitigate the negative impact of the crisis. Secondly, due to the nature of being a healthcare crisis, this brings many opportunities with it. Thirdly, the substantial uncertainty in markets also favour alternative assets, as for example, private equity funds are less sensitive to significant short-term volatility. 2021 was especially profitable for the private equity and hedge fund industry, which make up the largest part of alternative assets. In the following sections, hedge funds, private equity, private debt and crypto assets are discussed in a more detailed fashion. 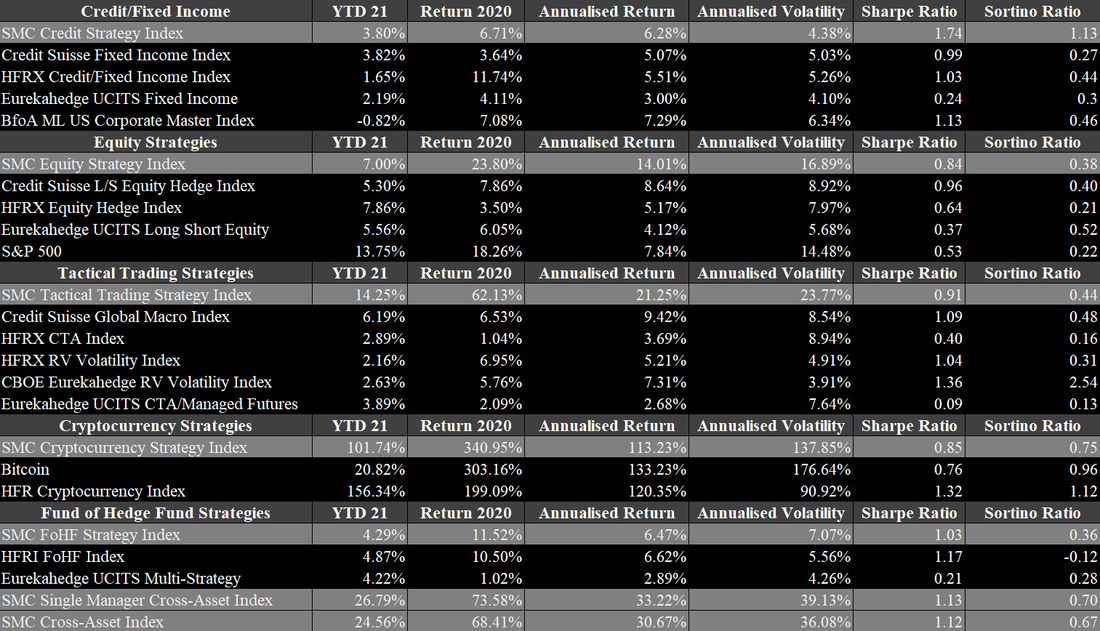
Hedge funds are doing very well currently. After having suffered substantial drawdowns in March 2020, they delivered what they promised to do. They were able to limit losses well, while profiting significantly from the subsequent upswing. This positioned hedge funds in a good light towards potential investors that previously stepped away from hedge funds or planned to, due to their frequent inability to generate excess returns in boom phases over the last few years. As the crisis was handled well by the industry, this perception significantly shifted. Preqin reported that the average return of hedge funds in 2020 was 16.69% and 12.73% as of June 2021, which are remarkable numbers for this environment. In particular, as some sectors and industries, such as fixed income, are struggling since Covid-19 emerged. Figures 9 to 14 provide a summary of our benchmark indices compared to other widely known benchmarks, based on fixed income, equity, tactical trading and fund of hedge funds strategies. Our two major benchmark indices, the SMC Single Manager Cross-Asset Index and the SMC Cross-Asset Index, are up 26.79% and 24.59% as of June 2021. Fixed Income strategies continue to struggle but managed to achieve solid one-digit returns over 2020 and 2021. The two most outstanding strategies in this asset class are European High Yield L/S Credit with a return of 13.37% in 2021 and Trade Finance Crypto with a YTD of 9.11%. The latter also has not experienced a single negative monthly return since its inception in January 2017. The performance of equity-based strategies in 2021 is 7%, while the individual strategies widely varied since 2020. On the one hand, Long/Short US Equity Consumer, TMT, Healthcare had a stellar return of 66% in 2020 but is stagnating in 2021 with a YTD of 0.13%. On the other hand, Equities US Activist Event Driven was up only 2.52% in 2020 but is up 30.68% in 2021 so far. Our SMC Tactical Trading Strategy Index is up 14% in 2021 and was up 62% in 2020. The global macro strategies deviate strongly from each other’s monthly returns. The Discretionary Global Macro strategy is up 26% in 2021, even though it suffered a loss of 18% in June 2021. In 2020, the strategy also achieved a return of 27%. The Systematic Global Macro strategy is up only 2% as of June 2021 but was up 97% in 2020. Unsurprisingly, the SMC Cryptocurrency Strategy Index had the best performance in both 2021 and 2020. In 2021, the index is up 101% and in 2020 340%. The crypto-based strategies range from Token Liquid with a YTD 2021 of 171% to Bitcoin that is up only 19.2% YTD 2021. Over the last two years, the Token strategy was the most successful one with being up 504% in 2020 and another 164% in 2021. Cryptocurrencies are further described in following section.
|
|
 RSS Feed

|
|
|
Stone Mountain Capital LTD is authorised and regulated with FRN: 929802 by the Financial Conduct Authority (‘FCA’) in the United Kingdom. The website content is neither an offer to sell nor a solicitation of an offer to buy an interest in any investment or advisory service by Stone Mountain Capital LTD and should be read with the DISCLAIMER. © 2024 Stone Mountain Capital LTD. All rights reserved. |