
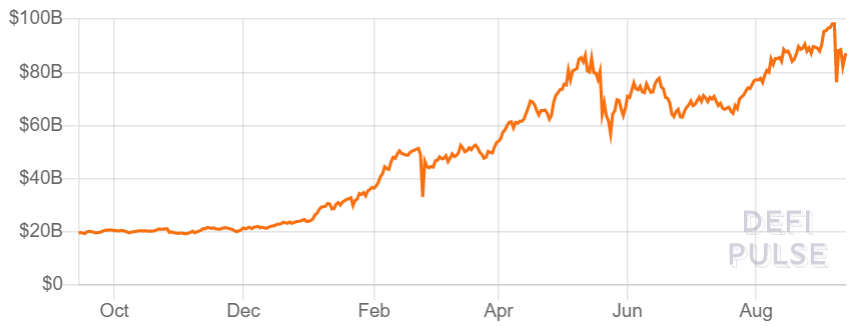
In such a highly uncertain environment, cryptocurrencies tend to thrive. Since the middle of July 2021, cryptocurrencies have performed very well. In particular applications on layer one chains, such as Bitcoin (BTC) and Ethereum (ETH), surged during this time. These applications can be split into several categories. These include for example, decentralized exchanges (DeX) and decentralized finance (DeFi). DeX’s are on the rise and are continuously optimized. At the current time, Uniswap v3 is the DeX with the largest trading volume ($800m in 24h), followed by PancakeSwap v2 with around $378m in 24h. In total, 10 different DeX’s have a daily trading volume exceeding $100m. These numbers are quite impressive given that centralized exchanges are young themselves. Binance, by far the largest cryptocurrency exchange, has a daily volume of $23bn. Coinbase, probably the most famous one due to going public, only has a daily volume of around $3bn. DeX’s have two major advantages compared to centralized exchanges. They tend to be cheaper, as only the gas for the transaction needs to be paid and they typically have no downtime, which occur quite frequently for centralized exchange in highly stressed environments. Yet, DeX’s remain a relatively small proportion of cryptocurrency exchanges. Over the last months, FTX was the most talked about exchange for several reasons. FTX is a cryptocurrency derivatives exchange and made headlines with its last funding round. FTX raised $900m and is now valued at $18bn. This is especially remarkable, as the company was valued at $1.2bn a year ago. Furthermore, there is barely any day without announcement about their attempt to increase their brand awareness. Tom Brady, Gisele Bundchen and Stephen Curry are just some brand ambassadors. They have also secured the naming right for stadiums, e.g. the Berkeley stadium, and have entered a multi-year sponsorship deal with the famous e-sport team TSM. Despite the significant spending on their brand awareness, the public seems to react well to their efforts, as their token (FTT) has reached a new record high, as shown in Figure 9. Another significant player among cryptocurrency exchanges is Bakkt, the first exchange that offered physically settled BTC futures and options and being owned by the Intercontinental Exchange (ICE). Although, it is known that Bakkt will go public since January 2021, it is widely anticipated that this should take place relatively soon. It is certainly interesting to find out where the second cryptocurrency company will end up after its SPAC listing valued at $2.1bn. The other category mentioned previously, DeFi, is more well-known since its application are very diverse. DeFi is typically measured by the total value locked (TVL) in DeFi, which is shown in Figure 10. Shortly before the most recent crash, TVL reached almost $100bn. At the time of writing, TVL is around $87bn. This is remarkable as at the beginning of 2020, TVL was only several million. Yet, the metric is not entirely transparent and various sources claim hugely different values. The issue with the metric is the tracking of the capital committed, measured by the collateral to make decentralized applications (DApps) comparable, as some of them are levered. But the measurement of TVL is difficult for several reasons. Firstly, the measure counts all values of different chains and the respective sub-chains. As they launch frequently, there can be mismatches. Secondly, various DApps allow all kinds of collaterals and those can be traded centralized, on-chain or off-chain, which makes their aggregation difficult to track. Lastly, value locked may be misleading, since liquidity can be added and removed very quickly, which poses additional tracking difficulties. DApps in DeFi also have the potential to revolutionize the traditional banking system, as basically any function from traditional banking is already available as DApp. Many early DApps focused on payment solutions, as many see the current payment methods
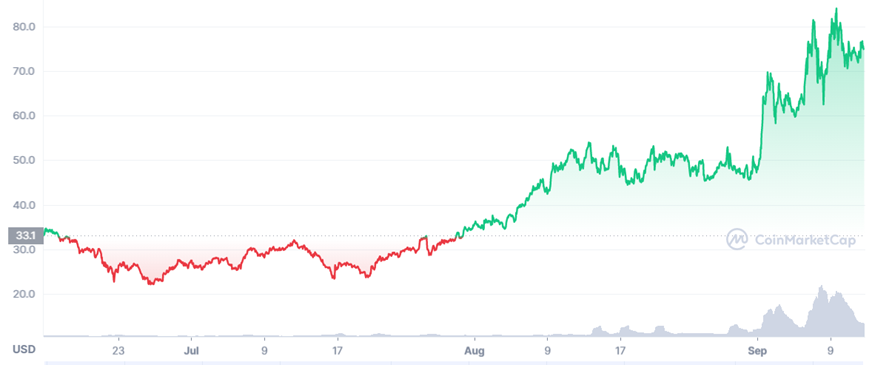
from the banking system as flawed in particular cross-border transactions, the time they require, and the fees associated with transactions. There are also many non-blockchain based solutions out there already with online banks, such as Revolut, or Wise that recently went public. Newer DApps started focusing on the lending function of the current banks. At the current stage, most capital in DeFi flows into such lending applications. The most valuable ones are Aave, Maker and InstaDApp, which all have around $13bn value locked in the application. InstaDApp is an asset management platform for DeFi platforms. It makes transactions between DeFi platforms easy, and it does not trigger fees, except the gas costs for the movement of assets. InstaDApp has now fully issued their token (INST). The price development of INST is shown in Figure 11.

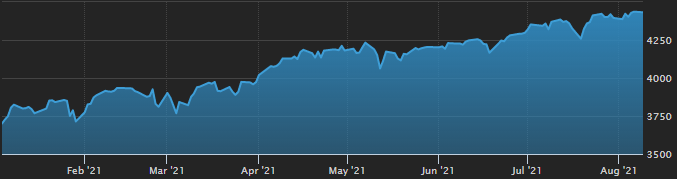
The macroeconomic environment will largely drive the market in H2 2021, which itself is based on significant degree how Covid-19 will evolve in the near future. With regards to the pandemic, the key questions are how the number of vaccinations evolve going forward, in particular as developed economies no longer have shortages of vaccines, but rather a declining number of people that want to get vaccinated. A crucial point is whether herd immunity can be achieved, either by being vaccinated or having had the virus. Another important point is how long the vaccine will last, as the cases of vaccinated people contracting the virus rises. Luckily, the symptoms seem to be minor. Probably even more important is whether new strains of the virus emerge that completely bypass vaccinations and essentially setting the world back to March 2020. The latter scenario seems less likely but should be considered to some degree. In a non-negative scenario, US inflation is likely to drop towards the end of the year with expectations around 3%. For the next years, it is expected that US inflation will remain between 2% and 3%, following the change in the FED’s inflation target of being 2% in the long-term instead of capping inflation at 2%. Thus, it is unlikely that inflation will drop below 2% for quite some time. In the EU, the inflation outlook is lower compared to the US, as the ECB expects inflation to rise to around 2.6% in Q4 2021. In 2022 and 2023, inflation is expected to remain around 1.5%. Furthermore, the FED and ECB also hinted at possibly putting more emphasis on employment instead of inflation going forward. This suggests gold being well positioned in the current market. As of July 2021, gold is almost back at its average in 2021 of $1800 per ounce. Despite being at a relatively high level historically, gold seems attractive with surging inflation and short-term interest rates being very close to 0%. Yet gold’s record high of more than $2000 per ounce lies back almost a year, at a point in which inflation was at 1% and not a concern for many. Since May 2021, inflows in gold ETFs are positive again albeit a bit sluggish. This is remarkable as previously, there were mostly only net outflows. Currently, the global gold AuM is at $214bn. Equities, in particular in the US, have experienced a great 2021, as shown in Figure 1. The S&P 500 is trading very close to its record high of around 4,450. During 2021, expectations for the S&P 500 level were adjusted multiple times. At the end of 2020, when the S&P 500 was 3,700, moderate expectations were around 3,900, while optimistic scenarios targeted 4,300. Yet, all those expectations were already surpassed in the low-interest rate environment, monetary stimulus and increased corporate earnings due to the recovery of the economy. Goldman Sachs has updated its target for the S&P 500 to 4,700 at the end of 2021. Contrarily, Chinese tech companies have suffered in July with the worst month since the financial crisis in 2008. Investors feared the crackdown of Chinese regulators on tech companies. Figure 2 shows valuations of Chinese companies listed in Hong Kong and in the US. Not only, are Chinese tech companies strongly undervalued compared to US tech stocks. Furthermore, Chinese tech companies listed in the US are even stronger undervalued, as very few even reach a multiple of 5, as shown in Figure 2.
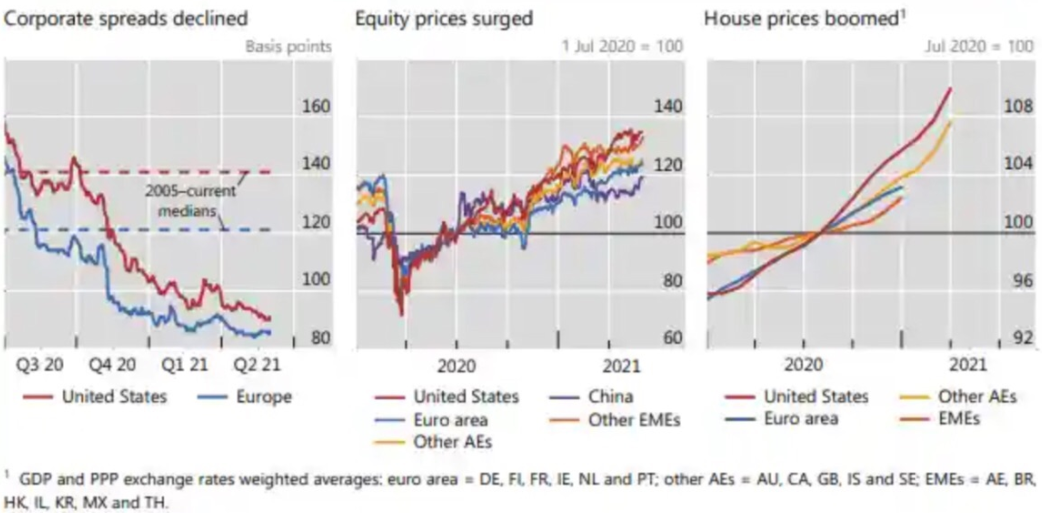
In the current market environment, alternative assets are well positioned. Due to the rise in inflation recently, the falling interest rates and equities being at record highs, it is difficult to allocate capital without huge risks. In this environment, alternative assets provide an attractive opportunity to reduce risk and increase the upside potential. During the last quarter, hedge funds and private equity have reached their record AuM. The interest in hedge funds is likely to increase further, as the industry is doing very well. Not only were drawdowns limited in March 2020, but the recovery was exceptionally strong. Furthermore, the gains in 2021 so far are the best in the last two decades and the number of launches outnumbered the numbers of closures in Q2 2021. Private equity has developed similarly over the last year. Although the beginning was difficult, the subsequent performance was great. However, operating in private equity needs a bit more caution, as a record amount of dry powder was assembled in the last year and the competition in the market fierce, which in turn, leads to higher prices and valuations. In particular in the VC space, voices of a bubble are getting louder. Housing prices have shown a very strong recovery from an initial slump after the pandemic hit, which is a consequence from the extraordinary financial conditions, largely caused by fiscal stimulus by governments and the loose monetary policy by central banks. Credit spreads have fallen to an almost record low level, despite declining profits from companies, at least initially. This suggests that market participants are aggressively seeking risk in the current financial market. Figure 1 shows a comparison of corporate spreads, equity prices and housing prices. On a relative scale, housing prices have risen more than equities since the initial Covid-19 outbreak. KKR for example has raised a $2.2bn fund for real estate deals in Europe, but real estate investments are surging as well in developing countries, such as in the UAE, in which luxury house sales are rising. There is also an increased interest in real estate tech which surged recently, certainly also boosted by the generally great performance of tech stocks.
|

|
 RSS Feed



|
|
|
Stone Mountain Capital LTD is authorised and regulated with FRN: 929802 by the Financial Conduct Authority (‘FCA’) in the United Kingdom. The website content is neither an offer to sell nor a solicitation of an offer to buy an interest in any investment or advisory service by Stone Mountain Capital LTD and should be read with the DISCLAIMER. © 2024 Stone Mountain Capital LTD. All rights reserved. |