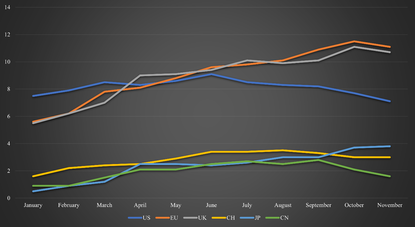
2023 followed the core theme of 2022 with a key focus on inflation and interest rates. At the beginning of 2023, inflation was a huge concern, due to its high level. In the US, inflation was at 6.5% and already declined substantially from its peak in June 2022 at 9.1%. This trend continued in 2023 until it reached its bottom in June 2023 at 3%. Since then, US inflation remained steady between 3% and 4%. The EU and the UK saw a very similar development of inflation throughout 2022. Their respective inflation started at around 5.5% in January 2022 and rose to 10.5% by the end of 2022. As soon as 2023 started, inflation in the EU started to decline and eventually declined to as low as 3.1% in November 2023. Despite this promising development, inflation began to increase again to 3.4% in December 2023. While the UK’s inflation development was almost equivalent to the EU’s in 2022, this changed in 2023. Inflation in the UK remained above 10% until April 2023, at which point inflation was at 10% or higher for almost an entire year. Nonetheless, UK inflation also came down later in 2023 and reached the 4% mark at the end of December 2023. Based on the overall relatively similar development of inflation around the world, it is likely that inflation will stay at elevated levels in the short term. Another key reason for relatively stale inflation is that central banks stopped hiking their interest rate for a while now in 2023. Figure 1 summarizes the development of inflation in the US, EU, and the UK.
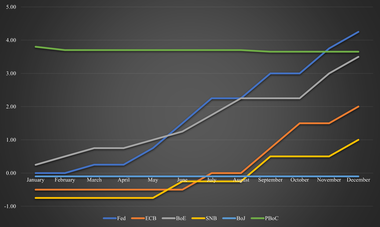
With the soaring inflation in 2021 and afterward, central banks had to react. Financial markets enjoyed rates close to zero, if not negative, for a long time. As a response, central banks started raising their interest rates. The Bank of England was the first to raise its interest rates in December 2021. The Fed followed in March 2022 and hiked its rate in every meeting and by a higher amount on average than the BoE or the ECB. The BoE did so too, but did smaller hikes on average. The ECB followed in June 2022, but they did not hike at every meeting. At the start of 2023, the interest rate in the US was already at 4.25% compared to 3.5% in the UK and 2.5% in the EU. Consequentially, the ECB hiked more in 2023 but did not reach the same heights as in the US or UK, which are currently at 5.25%, while the ECB’s interest rate remains at 4.5%. With interest rates now higher than inflation rates in each of those economies, most market participants expect interest rate cuts in 2024, especially due to an elevated possibility of a recession ahead. 
Inflation remains a major concern and continues to exert pressure on markets. At least inflation is declining in most economies. In the US, inflation is declining since July 2022 due to the most aggressive measures taken by the Fed in comparison to other economies. Inflation fell from over 9% to now below 5%. The EU’s inflation kept rising until September 2022 when it surpassed the 11% mark. The more hesitant central bank interventions and higher exposure to the war led to a substantially slower decrease. As of April 2023, inflation still remains slightly above 8%. Toward the end of 2022, the UK behaved similarly to the EU, but could not maintain this trend. As of March, inflation in the UK remained above 10%. The continued struggle of the UK – in comparison to the EU – is largely attributable to a combination of its higher food price inflation, high reliability on gas, and worker shortages as well as wage rises. The latest data revealed that the UK could substantially reduce its inflation in April to below 9%. China and Switzerland were able to keep their inflation below 4% throughout this period and have achieved decreasing inflation similar to the previously discussed economies, albeit for different reasons. Japan followed this development but saw a spike in inflation in April 2023, which stems from a surge in food prices. Figure 1 summarizes the inflation rate development from the beginning of 2022. Figure 2 shows the corresponding interest rate measures the various central banks undertook. The Fed took the most aggressive measures with the current range being between 5% and 5.25%. Market participants widely expected rate hikes to stop earlier in 2023, and it seems now that during the June meeting, there will be a break. However, officials stated that the fight against inflation is not over, and further hikes are still reasonably likely. This dampened the optimism of market participants, especially considering views at the beginning of the year with fewer increases and possible cuts as early as autumn. Such a development seems highly unlikely at this stage. The BoE followed the Fed’s development most closely. Unfortunately, it did not achieve the same results, as the substantial discrepancy in inflation data shows. The ECB took almost half a year longer to implement such measures. As of May 2023, central bank rates in the EU are still 1.25% lower than compared to the US. It is also reasonable to assume that the ECB will continue hiking to offset its currently substantially higher inflation. This can be attributed to the later reaction of the ECB in comparison to the Fed. Switzerland, which had fewer problems with inflation, required less severe interventions. In total, the SNB increased its core interest rate by 2.25% since May 2022. In contrast to other Western economies, its core interest rate sits at a moderate 1.5%. Asian countries, such as China and Japan have struggled little with inflation and needed no or only minor central bank interventions. Nonetheless, the countries still did not go through the aftermath of Covid unscathed.

With inflation remaining high, rates are trading higher than at the beginning of the year. While the view for 2023 is still largely pessimistic, in January the view shifted to more optimism, when most assets posted strong gains. However, this optimism faded to some degree again in February 2023. With inflation only going down slowly, more and more market participants expect rate cuts later than previously expected. This stance is also further supported by the central banks, especially by the Fed and ECB recently. In the US, this led to a substantial rise in longer maturity yields. Nonetheless, the yield curve inversion is still severe. Over the past weeks, yields on 6m- and 1Y-Treasuries have surpassed the 5%, whereas the 10Y-Treasuries are close to the 4% mark. The current yields also are also alarming for the real estate market that now sees a crisis ahead. House prices plummeted since 2020. At least, the impact is not that large as it has been during the global financial crisis, but it could still reach those levels with more time. The now high mortgage rates lead to a strong decrease in home construction. The last time it was this low was back in 1995. The particularly alarming thing is that this is despite the already strongly decreasing house prices. With rates unlikely to go down substantially any time soon, the industry is under significant pressure, which is likely to persist for a while. While the decreasing house prices are substantial, compared to its history, this decline is very small. Since the global financial crisis, the median house price in the US has doubled. In this context, the affordability of housing and in particular construction is at a very low level.

Inflation was a core issue in 2022 and remains to be one in 2023. In the US, inflation started to decline in the summer of 2022 and remains currently at a level of 7.1%. Contrarily, in Europe and the UK, inflation remains a huge issue and has barely declined from its peak in 2022. It remains at 11.1% for the EU and at 10.7% for the UK. The difference between the inflation can largely be attributed to two factors. Firstly, the Fed hikes interest rates more aggressively than its European counterparts. This led to a quicker response to inflation. Secondly, Europe is more directly affected by the war between Russia and Ukraine and is largely dependent on Russian oil and gas, which soared in price following the war. Contrarily to other European countries, Switzerland managed to keep inflation relatively low with a peak in late summer 2022 at 3.5% and 3% currently. Switzerland managed to avoid high inflation due to its strong currency and relatively low demand for fossil fuels, as most of its electricity stems from hydropower and nuclear power. In Asia, both Japan and China also experience limited inflation issues. Japan achieved this through its central bank which continuously intervenes with large-scale monetary easing. Despite the low inflation, Japan is still suffering, as wages remain stagnant unlike in other major economies where it helps offset the higher inflation to some degree. China does not face an inflation problem, due to their different handling of the Covid crisis. Unlike most economies, they did not provide large stimuli to the economy. Additionally, their zero-Covid policy substantially reduced household demands. Figure 1 shows a summary of the inflation rates across the highlighted economies during 2022. Regarding 2023, it is widely expected that inflation, especially in high-inflation countries, will come down. For instance, in the US, it is expected that inflation will be around 4% on average, and close to the 2% Fed target by the end of the year. Inflation forecasts in the EU and the UK are more difficult to estimate, due to their dependency on the war and its outcome. Additionally, unlike in the US, inflation has not really started to decrease. Assuming further strong interventions by the European central banks, it is expected that inflation will drop substantially. The ECB expects the average inflation to be around 5%-6% during 2023 with inflation slightly below 4% by the end of 2023. In the short term, Europe will be under pressure and the measures take time to become effective, as shown in the example of the US. Despite a similar outlook to the US, albeit with a delay of around half a year, it is less promising. One important wildcard is energy prices, which are strongly linked to the war. While the EU managed to get its oil largely from other sources than Russia, it still needs Russia, and gas is not as easily substitutable. With the prospect of Russia’s supply cut and China reopening, prices of energy sources are likely to increase. Depending on the scale, if it occurs, the anticipated target may not be reached and inflation will remain higher than the target. In Switzerland, inflation is expected to remain around the 3% mark for 2023. Given the strong involvement of the BoJ, Japan’s inflation is expected to end the year 2023 below the 2% inflation mark. It is additionally expected that wages will rise for the first time in three decades. Inflation in China is expected to rise to around 2% in 2023. This is a combination of the reopening of the economy and the end of the zero-Covid policy. This will lead to an increase in economic activity and the necessity for further energy. Additionally, the price pressure across will also be felt in China, once demand picks up again. The interest rate hikes by most countries have been another crucial topic during 2022. So far, the hikes have shown limited effectiveness in dealing with soaring inflation. In high-inflation countries, it was effective for the US and had little impact on the European countries. However, this discrepancy is likely due to the steeper hikes in the US and less dependency on the war by the US. The US employed the strongest measures, as it hiked from 0% at the beginning of 2022 to 4.25% at the end of 2022. In contrast, the ECB just started hiking in June 2022 at -0.5%, which increased to 2% by the end of 2022. The BoE employed a mixture of the two. The UK started hiking at the end of 2021 but hiked in smaller steps than the US. Towards the end of 2022, it increased the step size and is currently at 3.5%. Switzerland started hiking earlier than the ECB, despite substantially lower inflation. Switzerland’s prime rate became positive for the first time in years in September 2022. Currently, the prime rate is sitting at 1%. Japan was one of the exceptions, as the BoJ did not hike at all. Its prime rate remains at -0.1%. However, the central bank still strongly intervened in the market as elaborated previously. The People’s Bank of China even lowered its prime lending rate over 2022, albeit to a minimal degree. Currently, the rate is at 3.65%. There is a strong consensus for the year 2023 in the US and Japanese markets. Most market participants expect the Fed to keep raising interest rates to around 5%-5.25%. The Fed is likely to do this in smaller steps than previously. Nonetheless, this level should be reached by the end of Q1 2023. Afterward, a majority of institutions do not expect further hikes or cuts in 2023. The remainder anticipates potential interest rate cuts in Q4 2023. The exact outcome of potentially further hikes or cuts largely depends on the state of the US economy in the latter part of 2023. While the measures seem to be effective and inflation is going down considerably, the risk of a recession is considerable. This largely stems from substantially higher financing costs for businesses, and lower demand from consumers as Covid reserves are exhausted and households feel the pressure from the inflation over the past year. Given that the BoJ has not intervened by raising interest rates, it is not expected that it will in 2023. It is more likely that it will continue its qualitative and quantitative easing philosophy employed so far. In particular, as Japan does not face an imminent inflation problem. With expected wages adjusted, the pressure of inflation should also be eased without a strong necessity to make policy adjustments. For the EU, it is expected that rates will be hiked further to combat the prevalent inflation. Market participants expect interest rates of around 3%, which should be reached during Q2 2023. For the UK, additional hikes of 1% are expected, resulting in interest rates of around 4.5% for 2023. For both economies, no rate cuts are expected in the latter half of 2023. In Switzerland, the SNB is anticipated to hike another 0.5% in 2023 with no rate cuts as well.
|
|
 RSS Feed

|
|
|
Stone Mountain Capital LTD is authorised and regulated with FRN: 929802 by the Financial Conduct Authority (‘FCA’) in the United Kingdom. The website content is neither an offer to sell nor a solicitation of an offer to buy an interest in any investment or advisory service by Stone Mountain Capital LTD and should be read with the DISCLAIMER. © 2024 Stone Mountain Capital LTD. All rights reserved. |