
Inflation and interest rates were key issues as central banks flooded the world economy with capital to combat the adverse effects of Covid-19. Inflation began to rise rapidly, reaching levels not seen for a long time. In the US, inflation rose to 9% by the summer of 2022. As inflation rose, the Federal Reserve began to raise interest rates aggressively in early 2022. When inflation peaked in the summer of 2022, it started to fall, reaching manageable levels of 3%-4% in the spring of 2023. So far, inflation has not really fallen below these levels. Interest rates were raised to 5.25%-5.5% by the summer of 2023. At the time, investors were expecting significant rate cuts in 2024, as inflation had fallen significantly and central bank measures typically have a significant time lag before they take effect. Investors were also more optimistic about rate cuts as a recession seemed inevitable. To combat a potential crisis, interest rate cuts could have mitigated the expected recession. Despite many common indicators, a recession has not (yet) materialised, even with geopolitical tensions around the globe. In addition, inflation has proved to be very sticky, which has prevented the Federal Reserve from lowering interest rates so far. Looking ahead to H2 2024, inflation is likely to remain at similar levels, with a slight tendency towards the 2% mark. Inflation could spike again if geopolitical tensions and the current wars escalate significantly. Currently, interest rates are expected to be lowered two times by 25bps by the end of 2024, which would bring the target rate to 4.75%-5%. Further cuts are unlikely and would only occur if inflation were to fall very soon and remain at these levels or fall further. No cuts or even hikes cannot be ruled out either, especially if inflation were to pick up again. Figure 1 shows the development of inflation and interest rates in the US since January 2022.

Cryptocurrencies started very promising in 2024, with the approval of the first spot Bitcoin ETFs on 10th January. In anticipation of a possible approval, Bitcoin started to surge in December 2023, which also led to price increases for other cryptocurrencies. Shortly after the approval, the much-anticipated Bitcoin Halving further boosted the ecosystem with a particularly strong performance in March 2024. The Bitcoin Halving took place in mid-April, leading to a slight dip in the market. Historically, this is a common occurrence, with most of the gains occurring ahead of the event, followed by a period of “selling the news” or profit taking, leading to slight declines. In addition, several ETF providers also applied for approval of spot Ether ETFs following the approval of Bitcoin ETFs. Until mid-May 2024, the chances of approval were almost unanimously seen as close to zero. However, when the SEC set a deadline for the decision, the view on a potential approval quickly changed. A few days later, the SEC released a statement confirming the approval of spot Ether ETFs on 23rd May 2024. Figure 1 shows the price of Ethereum from 2023 to the present and its performance since then. Most of Ethereum's gains this year have come from the very strong February and March, with another significant spike when the SEC released the statement on the ETF approval deadline. At the time of writing, ETH is trading at $3.8k with a market capitalisation of $463bn.
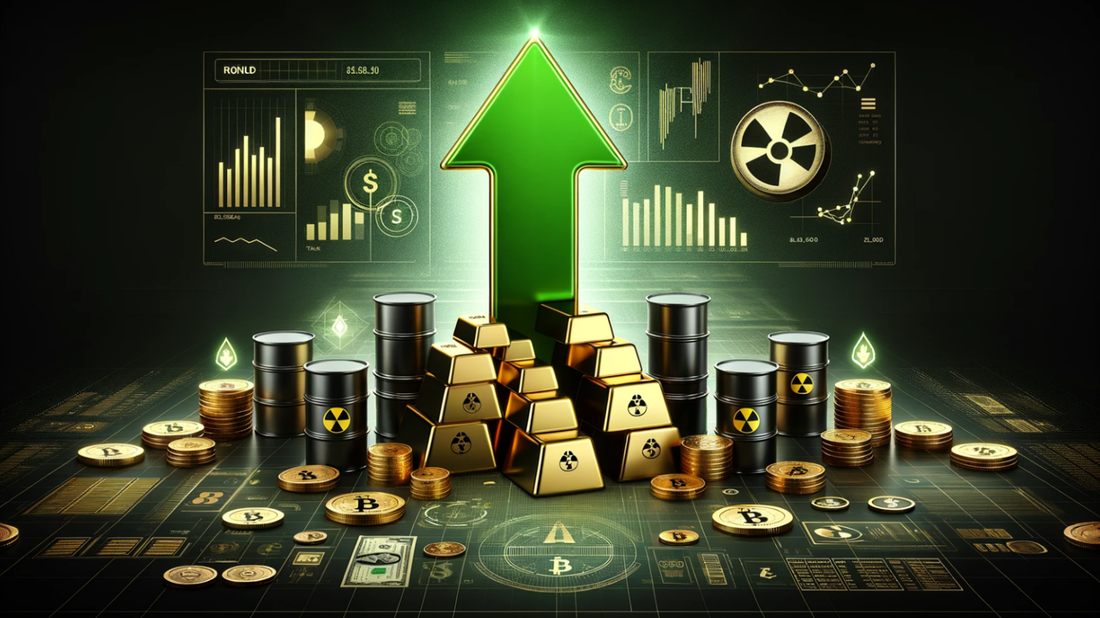
Gold started surging substantially in March and April 2024 and reached a new record high of $2,401 per ounce. At the time of writing, gold is trading slightly lower at $2,335, as shown in Figure 1. Gold reaching high prices seems reasonable in the current state of the economy. However, the exact timing does not support this breakout. Gold flourishes in high inflation, high uncertainty, and recession ecosystems. High uncertainty is certainly true with continued geopolitical tensions, e.g. Russia-Ukraine, Israel-Palestine-Iran, etc. While there is no recession currently, indicators imply a recession for years now, which is further supported by the growing tensions around the world. High inflation was present, and inflation is still moderately high. Nonetheless, interest rates, even on a real basis, are high, which historically has shown to behave anticyclical to gold. The current view on a “higher for longer” ecosystem, which implicates high interest rates for a longer time, also does not favour gold. While uncertainty and a potential recession are valid reasons for increases in gold prices, it further benefits from the fact that the asset will likely perform well whether there is a recession or not, which not many other assets can claim. Additionally, central banks have been accumulating a lot of gold, especially China and Eastern countries. Perhaps, Eastern central banks have acquired the amount of gold Western countries are ready to sell, which leads to a shortage of supply and increasing prices.
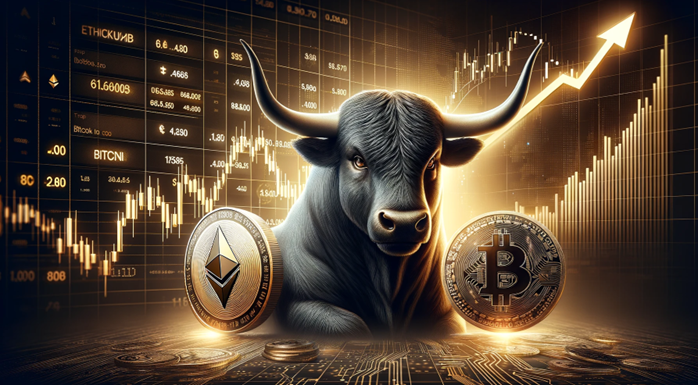
The cryptocurrency market is maintaining the strong momentum it gained at the beginning of the year. Bitcoin (BTC) is spearheading the lead in the space. BTC soared to above $73k as of the time of writing and surpassed its previous high of $68k achieved back in 2021. To date, BTC is up 70% in 2024. The most notable reasons for the strong performance are the spot BTC ETF approval and the subsequent money flowing into BTC. For example, BlackRock now owns more than $10bn in BTC. Another key driver is the upcoming Bitcoin Halving that is anticipated to occur in mid-April 2024. Historically, this event starts the strongest bull run in the BTC cycle. Thus far, BTC was among the best-performing crypto assets in 2024, but Ethereum (ETH) managed to overtake BTC over the past few days and gained 78% in 2024. This development is also akin to prior cycles, when BTC typically initiates the bull run, while other tokens follow BTC and post stronger gains further in the bull run. However, unlike BTC, ETH has not managed to surpass its previous high of nearly $4.9k from 2021. Most recently, ETH surpassed the $4k for the first time since 2021. Figure 1 shows the price development of BTC and ETH from the end of 2022 to March 2024 alongside each token's previous high. Corresponding to these trends is the development of the crypto market capitalization. With the major currencies being close to or above their previous highs, the total cryptocurrency market cap is also close to a new record high. As of the time of writing, the crypto market cap is above $2.7tn, which is slightly lower than its previous high of $2.8tn.
|
|
 RSS Feed

|
|
|
Stone Mountain Capital LTD is authorised and regulated with FRN: 929802 by the Financial Conduct Authority (‘FCA’) in the United Kingdom. The website content is neither an offer to sell nor a solicitation of an offer to buy an interest in any investment or advisory service by Stone Mountain Capital LTD and should be read with the DISCLAIMER. © 2024 Stone Mountain Capital LTD. All rights reserved. |