2023 followed the core theme of 2022 with a key focus on inflation and interest rates. At the beginning of 2023, inflation was a huge concern, due to its high level. In the US, inflation was at 6.5% and already declined substantially from its peak in June 2022 at 9.1%. This trend continued in 2023 until it reached its bottom in June 2023 at 3%. Since then, US inflation remained steady between 3% and 4%. The EU and the UK saw a very similar development of inflation throughout 2022. Their respective inflation started at around 5.5% in January 2022 and rose to 10.5% by the end of 2022. As soon as 2023 started, inflation in the EU started to decline and eventually declined to as low as 3.1% in November 2023. Despite this promising development, inflation began to increase again to 3.4% in December 2023. While the UK’s inflation development was almost equivalent to the EU’s in 2022, this changed in 2023. Inflation in the UK remained above 10% until April 2023, at which point inflation was at 10% or higher for almost an entire year. Nonetheless, UK inflation also came down later in 2023 and reached the 4% mark at the end of December 2023. Based on the overall relatively similar development of inflation around the world, it is likely that inflation will stay at elevated levels in the short term. Another key reason for relatively stale inflation is that central banks stopped hiking their interest rate for a while now in 2023. Figure 1 summarizes the development of inflation in the US, EU, and the UK.
With the soaring inflation in 2021 and afterward, central banks had to react. Financial markets enjoyed rates close to zero, if not negative, for a long time. As a response, central banks started raising their interest rates. The Bank of England was the first to raise its interest rates in December 2021. The Fed followed in March 2022 and hiked its rate in every meeting and by a higher amount on average than the BoE or the ECB. The BoE did so too, but did smaller hikes on average. The ECB followed in June 2022, but they did not hike at every meeting. At the start of 2023, the interest rate in the US was already at 4.25% compared to 3.5% in the UK and 2.5% in the EU. Consequentially, the ECB hiked more in 2023 but did not reach the same heights as in the US or UK, which are currently at 5.25%, while the ECB’s interest rate remains at 4.5%. With interest rates now higher than inflation rates in each of those economies, most market participants expect interest rate cuts in 2024, especially due to an elevated possibility of a recession ahead. 
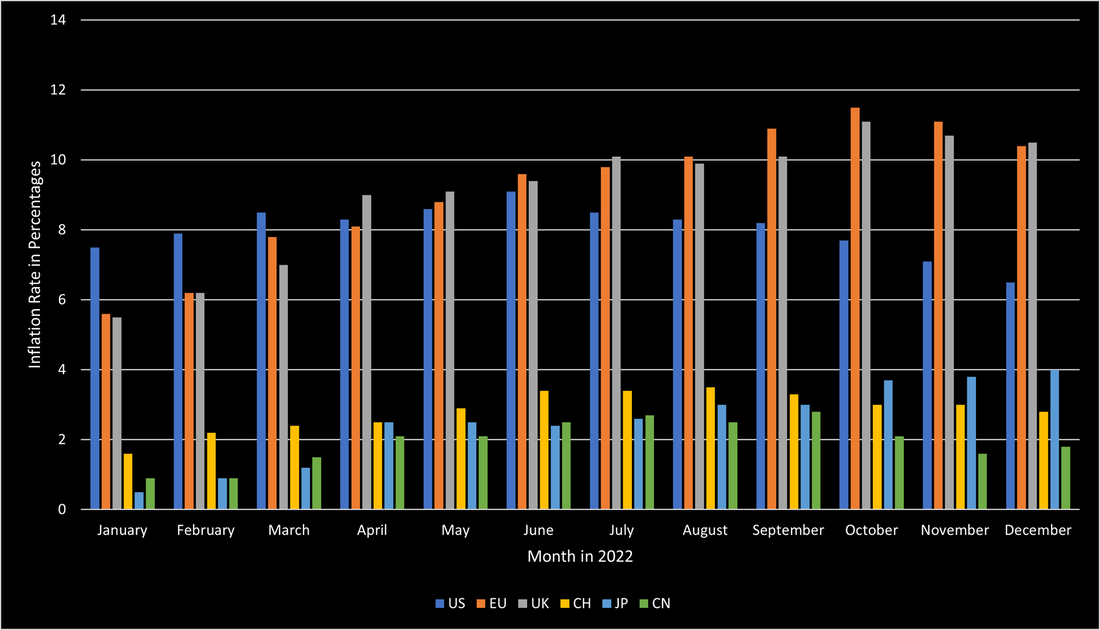
2022 was a year that tested the worldwide economy. The highest inflation in 40 years, unprecedented interest rate hikes, and the invasion of Russia into Ukraine were only some contributors to the hugely difficult year of 2022. In the US, inflation started soaring during 2021 and peaked in the summer of 2022 at 9.1%. Thanks to the central bank’s quick response, inflation has since continuously slowed down and is currently at 6.5%. Europe had significantly more issues handling the inflation crisis. The EU started the year at an inflation rate of slightly above 5.5% and it continued to soar until October 2022 when it reached its peak at 11.5%. The UK was similarly affected, despite the BoE being the fastest-acting central bank to raise interest rates. However, its inflation behaved like the EU’s and soared to its peak at 11.1% in October 2022. Both economies have not been able to reduce inflation below 10% so far. In contrast to the US, European countries were much more affected by the direct impact of the war between Russia and Ukraine. Soaring energy and food prices, for both of which Russia and Ukraine are crucial suppliers, were the main constituents causing the high inflation. Additionally, the ECB did not enjoy as much freedom as the Fed had when raising interest rates. This is in large part due to the high indebtedness of certain European countries that would have gone bankrupt if interest rates would have been raised as much as the US did. Other countries, such as Switzerland, Japan, and China stand out in this discussion, as those countries managed to keep their inflation relatively low. Switzerland managed to avoid such high inflation due to its strong currency, and a limited dependency on fossil fuels. Japan avoided high inflation through the continued quantitative easing by the BoJ. However, in contrast to the other countries, Japan’s inflation is still soaring and poses substantial issues to the country. China avoided high inflation through its rigorous Covid policies and its limited governmental support when Covid emerged. The source of this soaring inflation is a combination of the war but is largely based on unprecedented central bank intervention to save the economy during the early Covid days when large parts of the economy were completely unable to function. Figure 1 shows the inflation levels of the previously mentioned countries during 2022.
Alternative Markets Summary H1 2022
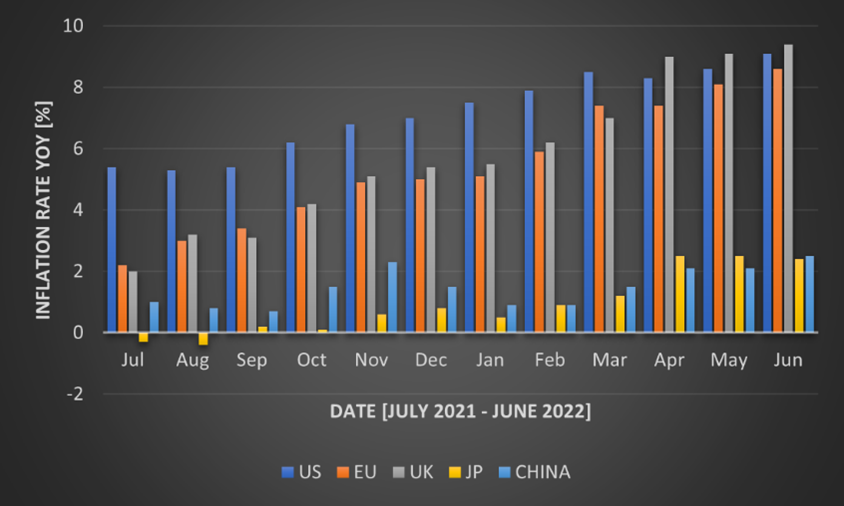
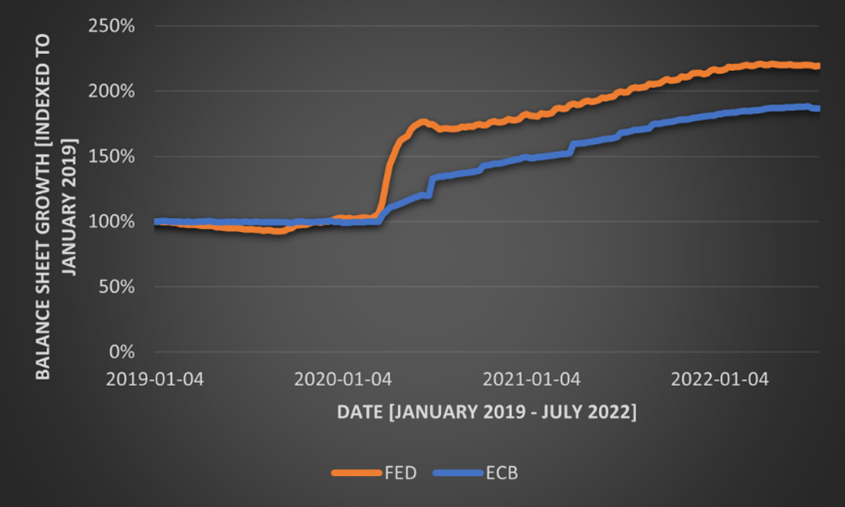
Ever since Covid-19 has subsided from the daily news, inflation has taken over. Inflation is still a major concern in the current economy. This is further exacerbated by central bank interventions that have not been fruitful yet. An additional major contributor is the ongoing war between Russia and Ukraine. As of June 2022, inflation in the US is at 9.1%, the highest it has been in the past 40 years. In the Eurozone, inflation is slightly lower at 8.6%. The UK’s inflation is even higher at 9.4%. Asian countries, such as Japan and China, managed to keep their inflation relatively low at 2.4% and 2.5%. The development of inflation over the past year is summarized in Figure 1. For Western countries, inflation has more or less continuously risen. The US started the year with inflation close to over 5%, while European countries were close to 2%. Nonetheless, Europe has caught up to the US since April, when the UK’s inflation even got higher than the US’s. A potential reason for the higher inflation in the US at the beginning of the year and back until the latter half of 2021 is the rapid and steep unconventional measures taken by the Fed. This faster intervention led to more money being in the economy earlier, which theoretically should lead to higher inflation earlier. Figure 2 shows the growth in the balance sheet indexed to January 2019. Once Covid-19 hit the economy, the US reacted a lot faster and in higher magnitudes than Europe did. Within the first months, the Fed’s balance sheet grew by almost 70%, while the ECB’s only grew by 25% in the same time frame. Since then, the two central banks acted equivalently in terms of balance sheet growth. Very recently, the central banks started to shrink their balance sheets. These measures were announced during Q2 2022 and are slowly implemented. Going forward, this balance sheet shrinking will be strengthened, which is confirmed by an announcement from the ECB recently. Nonetheless, as the graph shows, these measures barely affect the original measures taken to combat the economic consequences of Covid-19. The low inflation in China largely stems from the consequences of their zero-Covid policy. In recent months, many places have been shut down to control the spread of Covid. This led to low production levels and low demand which is reflected in the low inflation levels of the country. In the case of Japan, inflation of above 2% is significant, as the average inflation during the past three decades was only 0.3%. Its inflation largely stems from the consequences of the war and the impact it has on food and energy.
Inflation remains a major concern in 2022. It is also crucial to watch the central banks’ responses to deal with it. In particular, the inflation numbers in the coming months should be watched closely, as they likely determine the extent to which central banks intervene. As seen in May 2022, when the CPI was higher than expected, markets lost substantially. With current market expectation of US interest rates being close to 2% later this year, it is vital that the 50bps hike last month, as well as the upcoming hike (likely another 50bps) show effectiveness. If that should not hold, there will be a bumpy road ahead. Especially, as the Fed is starting to reduce its balance sheet, which puts further pressure on markets. A similar observation can be made for the UK. For the EU, this is likely occur a couple of months later, as they have not raised interest rates yet, but are expected to do very soon. This development, alongside the war and supply chain issues, has led to a more and more pessimistic view of GDP growth in most countries. The World Bank expects that most countries will in fact experience a recession. They further emphasize that stagflation is looming. The possibility of a stagflation environment is certainly not unlikely and many factors speak for it. For example, the very high inflation, frequently downward-adjusted GDP projections, and the pressure put on companies with significant supply chain problems among others. Although employment looks healthy in most countries, if this should worsen, the treat of stagflation becomes very urgent. A more detailed view on the macroeconomic situation is provided by Macro Eagle further below. Hedge funds are in a good position to mitigate much of this market volatility. Many hedge funds pursuing equity and fixed income strategies have experienced rough times but they have the capabilities to reduce risk in such a market environment, despite a rather unimpressive performance. Hedge funds that use different strategies than the previously mentioned ones, mostly had a great year. This is in particular true for global macro funds. A substantial number of funds managed to deliver a YTD in 2022 in excess of 100% already. Another strategy that stands out are funds of hedge funds that could truly show their risk mitigation potential. Although private equity and venture capital could not maintain their trend from 2021, the asset class still remains an attractive opportunity. Valuations are down since early 2022. However, the industry is still in a healthy state, despite the slump of public equities. Inflows in the industry are likely to be smaller than in 2021, but there is still significant investor interest as most investors report that their private equity investment substantially outperformed their public equity investments over the long-term. The industry also still sits on a large cash pile amassed over the past year that needs to be deployed. This pressure further mitigates the decline in valuations resulting from the bear market.
|
|
 RSS Feed

|
|
|
Stone Mountain Capital LTD is authorised and regulated with FRN: 929802 by the Financial Conduct Authority (‘FCA’) in the United Kingdom. The website content is neither an offer to sell nor a solicitation of an offer to buy an interest in any investment or advisory service by Stone Mountain Capital LTD and should be read with the DISCLAIMER. © 2024 Stone Mountain Capital LTD. All rights reserved. |