
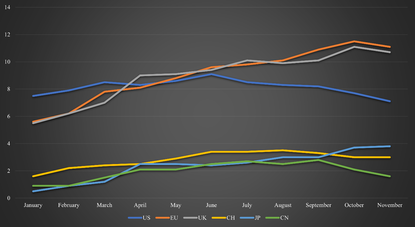
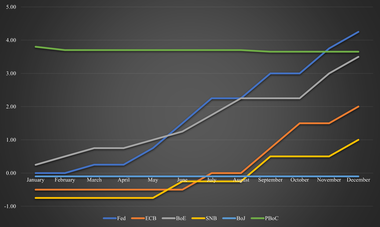
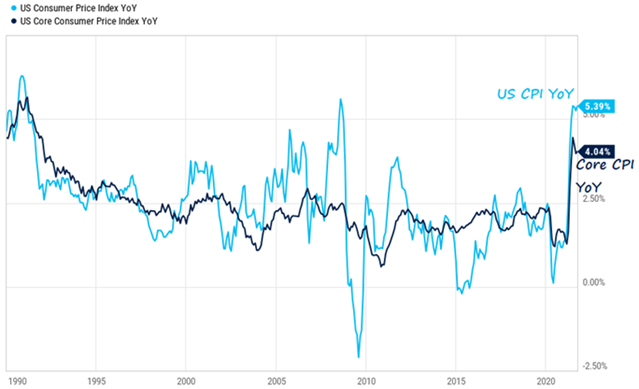
Inflation was a core issue in 2022 and remains to be one in 2023. In the US, inflation started to decline in the summer of 2022 and remains currently at a level of 7.1%. Contrarily, in Europe and the UK, inflation remains a huge issue and has barely declined from its peak in 2022. It remains at 11.1% for the EU and at 10.7% for the UK. The difference between the inflation can largely be attributed to two factors. Firstly, the Fed hikes interest rates more aggressively than its European counterparts. This led to a quicker response to inflation. Secondly, Europe is more directly affected by the war between Russia and Ukraine and is largely dependent on Russian oil and gas, which soared in price following the war. Contrarily to other European countries, Switzerland managed to keep inflation relatively low with a peak in late summer 2022 at 3.5% and 3% currently. Switzerland managed to avoid high inflation due to its strong currency and relatively low demand for fossil fuels, as most of its electricity stems from hydropower and nuclear power. In Asia, both Japan and China also experience limited inflation issues. Japan achieved this through its central bank which continuously intervenes with large-scale monetary easing. Despite the low inflation, Japan is still suffering, as wages remain stagnant unlike in other major economies where it helps offset the higher inflation to some degree. China does not face an inflation problem, due to their different handling of the Covid crisis. Unlike most economies, they did not provide large stimuli to the economy. Additionally, their zero-Covid policy substantially reduced household demands. Figure 1 shows a summary of the inflation rates across the highlighted economies during 2022. Regarding 2023, it is widely expected that inflation, especially in high-inflation countries, will come down. For instance, in the US, it is expected that inflation will be around 4% on average, and close to the 2% Fed target by the end of the year. Inflation forecasts in the EU and the UK are more difficult to estimate, due to their dependency on the war and its outcome. Additionally, unlike in the US, inflation has not really started to decrease. Assuming further strong interventions by the European central banks, it is expected that inflation will drop substantially. The ECB expects the average inflation to be around 5%-6% during 2023 with inflation slightly below 4% by the end of 2023. In the short term, Europe will be under pressure and the measures take time to become effective, as shown in the example of the US. Despite a similar outlook to the US, albeit with a delay of around half a year, it is less promising. One important wildcard is energy prices, which are strongly linked to the war. While the EU managed to get its oil largely from other sources than Russia, it still needs Russia, and gas is not as easily substitutable. With the prospect of Russia’s supply cut and China reopening, prices of energy sources are likely to increase. Depending on the scale, if it occurs, the anticipated target may not be reached and inflation will remain higher than the target. In Switzerland, inflation is expected to remain around the 3% mark for 2023. Given the strong involvement of the BoJ, Japan’s inflation is expected to end the year 2023 below the 2% inflation mark. It is additionally expected that wages will rise for the first time in three decades. Inflation in China is expected to rise to around 2% in 2023. This is a combination of the reopening of the economy and the end of the zero-Covid policy. This will lead to an increase in economic activity and the necessity for further energy. Additionally, the price pressure across will also be felt in China, once demand picks up again. The interest rate hikes by most countries have been another crucial topic during 2022. So far, the hikes have shown limited effectiveness in dealing with soaring inflation. In high-inflation countries, it was effective for the US and had little impact on the European countries. However, this discrepancy is likely due to the steeper hikes in the US and less dependency on the war by the US. The US employed the strongest measures, as it hiked from 0% at the beginning of 2022 to 4.25% at the end of 2022. In contrast, the ECB just started hiking in June 2022 at -0.5%, which increased to 2% by the end of 2022. The BoE employed a mixture of the two. The UK started hiking at the end of 2021 but hiked in smaller steps than the US. Towards the end of 2022, it increased the step size and is currently at 3.5%. Switzerland started hiking earlier than the ECB, despite substantially lower inflation. Switzerland’s prime rate became positive for the first time in years in September 2022. Currently, the prime rate is sitting at 1%. Japan was one of the exceptions, as the BoJ did not hike at all. Its prime rate remains at -0.1%. However, the central bank still strongly intervened in the market as elaborated previously. The People’s Bank of China even lowered its prime lending rate over 2022, albeit to a minimal degree. Currently, the rate is at 3.65%. There is a strong consensus for the year 2023 in the US and Japanese markets. Most market participants expect the Fed to keep raising interest rates to around 5%-5.25%. The Fed is likely to do this in smaller steps than previously. Nonetheless, this level should be reached by the end of Q1 2023. Afterward, a majority of institutions do not expect further hikes or cuts in 2023. The remainder anticipates potential interest rate cuts in Q4 2023. The exact outcome of potentially further hikes or cuts largely depends on the state of the US economy in the latter part of 2023. While the measures seem to be effective and inflation is going down considerably, the risk of a recession is considerable. This largely stems from substantially higher financing costs for businesses, and lower demand from consumers as Covid reserves are exhausted and households feel the pressure from the inflation over the past year. Given that the BoJ has not intervened by raising interest rates, it is not expected that it will in 2023. It is more likely that it will continue its qualitative and quantitative easing philosophy employed so far. In particular, as Japan does not face an imminent inflation problem. With expected wages adjusted, the pressure of inflation should also be eased without a strong necessity to make policy adjustments. For the EU, it is expected that rates will be hiked further to combat the prevalent inflation. Market participants expect interest rates of around 3%, which should be reached during Q2 2023. For the UK, additional hikes of 1% are expected, resulting in interest rates of around 4.5% for 2023. For both economies, no rate cuts are expected in the latter half of 2023. In Switzerland, the SNB is anticipated to hike another 0.5% in 2023 with no rate cuts as well.
Alternative Markets Summary H1 2022
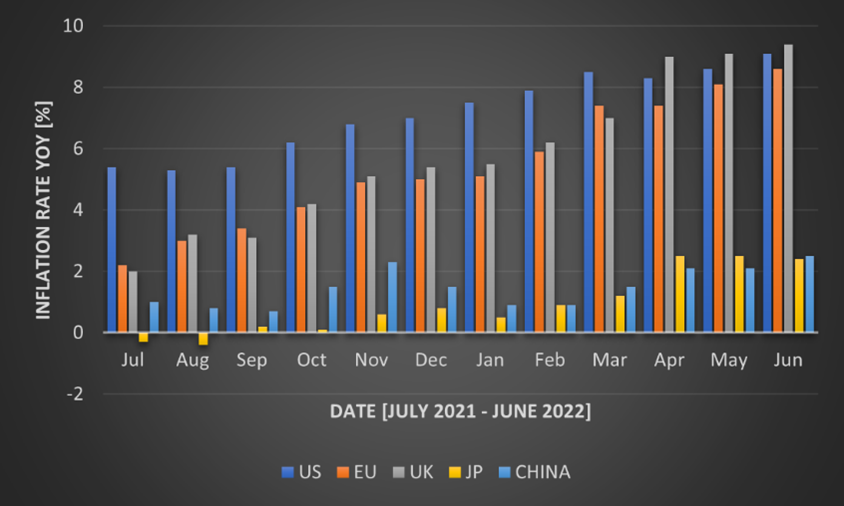
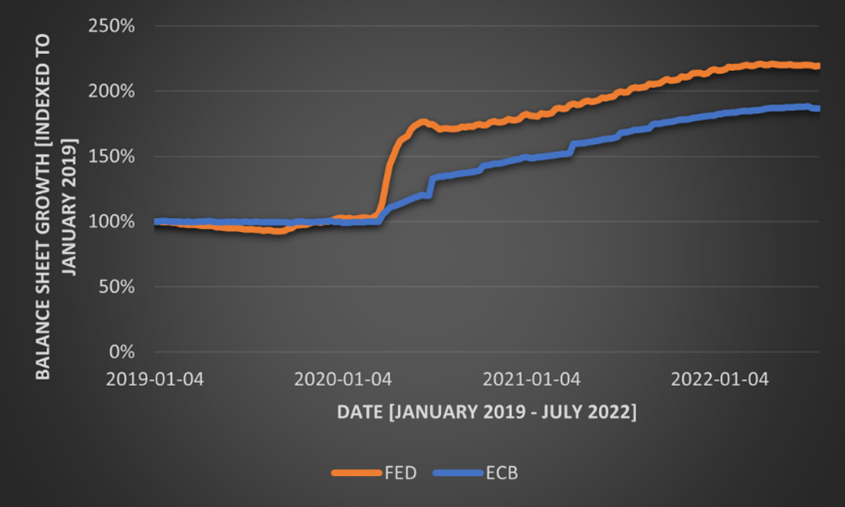
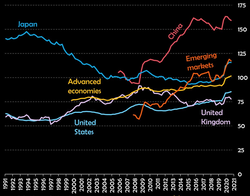
Ever since Covid-19 has subsided from the daily news, inflation has taken over. Inflation is still a major concern in the current economy. This is further exacerbated by central bank interventions that have not been fruitful yet. An additional major contributor is the ongoing war between Russia and Ukraine. As of June 2022, inflation in the US is at 9.1%, the highest it has been in the past 40 years. In the Eurozone, inflation is slightly lower at 8.6%. The UK’s inflation is even higher at 9.4%. Asian countries, such as Japan and China, managed to keep their inflation relatively low at 2.4% and 2.5%. The development of inflation over the past year is summarized in Figure 1. For Western countries, inflation has more or less continuously risen. The US started the year with inflation close to over 5%, while European countries were close to 2%. Nonetheless, Europe has caught up to the US since April, when the UK’s inflation even got higher than the US’s. A potential reason for the higher inflation in the US at the beginning of the year and back until the latter half of 2021 is the rapid and steep unconventional measures taken by the Fed. This faster intervention led to more money being in the economy earlier, which theoretically should lead to higher inflation earlier. Figure 2 shows the growth in the balance sheet indexed to January 2019. Once Covid-19 hit the economy, the US reacted a lot faster and in higher magnitudes than Europe did. Within the first months, the Fed’s balance sheet grew by almost 70%, while the ECB’s only grew by 25% in the same time frame. Since then, the two central banks acted equivalently in terms of balance sheet growth. Very recently, the central banks started to shrink their balance sheets. These measures were announced during Q2 2022 and are slowly implemented. Going forward, this balance sheet shrinking will be strengthened, which is confirmed by an announcement from the ECB recently. Nonetheless, as the graph shows, these measures barely affect the original measures taken to combat the economic consequences of Covid-19. The low inflation in China largely stems from the consequences of their zero-Covid policy. In recent months, many places have been shut down to control the spread of Covid. This led to low production levels and low demand which is reflected in the low inflation levels of the country. In the case of Japan, inflation of above 2% is significant, as the average inflation during the past three decades was only 0.3%. Its inflation largely stems from the consequences of the war and the impact it has on food and energy.
Hedge Funds
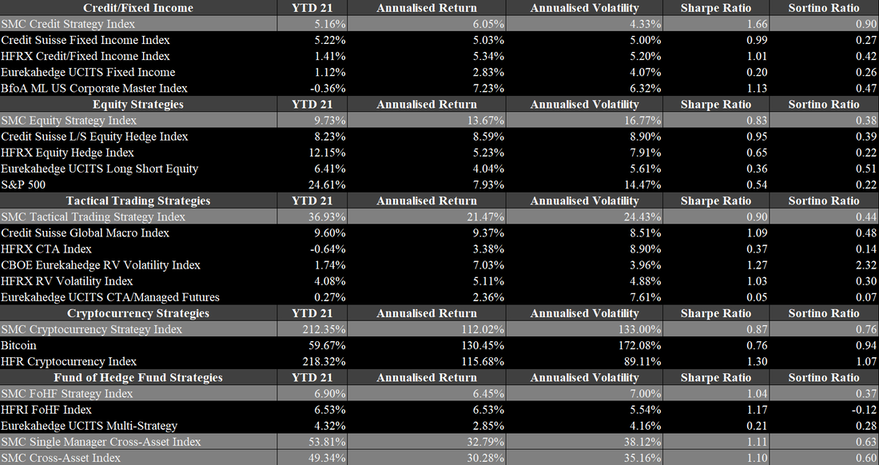
Hedge funds had a great 2021 and managed to set a record high in its AuM. As of the third quarter in 2021, the AuM of the industry is expected to be between $4.3tn and $4.6tn depending on the sources. According to BarclayHedge, the industry’s AuM just surpassed the $4.5tn mark at the end of the third quarter. This is a steep increase from just $3.8tn in 2020, as shown in Figure 6. This is a gain of more than 18% in less than a year. It is expected that the number will rise slightly, once the Q4 2021 numbers are out, as October and November 2021 were rather positive. Nonetheless, December 2021 will have dampened the results of Q4 2021. Generally, the industry has gained substantially over the past ten years, despite a rather inferior view from market participants during most of that period. The AuM soared thanks to two reasons. Firstly, the industry saw substantial capital net inflows. During the first three quarters, the industry received $41bn in fresh capital after having received another $19bn in the second half of 2020. Since then, the industry saw net inflows in every quarter, which is stark break from previous years when the industry experienced net outflows in most quarters. In Q4 2021, net inflows rose to $81bn in 2021, according to Eurekahedge. Figure 7 also shows the severe initial impact of Covid-19 in 2020, when accounting for the significantly positive inflows in the latter half of the year. The second reason for the steep increase in AuM is due to the performance of the hedge fund industry in 2021. Hedge funds in 2021 returned slightly more than 10%, making it the third best year in history after 2020 and 2009 according to HFR. This is remarkable, as the year has not been easy with the constant uncertainty and high volatility in the market. In particular event-driven, equity and commodity strategies have performed very well and the high beta strategies within their respective sector. Figure 8 summarizes the performances of several strategies during 2021 by Eurekahedge. Distressed debt and event-driven strategies performed best with barely any negative performances during the year. Macro and fixed income strategies struggled the most throughout the year, due to the harsh economic conditions. When looking at the highlighted percentiles, it is evident that the high volatility in the market also caused high volatility in hedge fund returns, independent of the strategy. This is most relevant for long short equity strategies whose returns vary between +30% (upper percentile) and -10% (lower percentile) in 2021. Figures 9 to 13 highlight the SMC Strategy Indices in 2021 compared to their benchmarks. The SMC Credit Strategy Index gained slightly more than 5% in 2021, although the variation across strategies is substantial. Two strategies, Trade Finance Crypto and European High Yield L/S Credit did very well in the economic environment, as they reached returns above 12% and 19% in 2021. The Trade Finance Strategy is in particular remarkable, as the strategy has not experienced a negative month since its inception in 2017. The SMC Equity Strategy Index gained closely less than 10%, which is around as much as the average equity strategy in 2021. Within the sector, there was also considerable volatility, due to the sub-strategies. Unsurprisingly, the Equities US Activist Event-Driven performed best with a return exceeding 33%. More tech-focused strategies faced more issues but returned closely below 10% after an extremely successful 2020. Global macro strategies had a tough year and closed only slightly positive for the year. The SMC Global Macro Strategy Index is up almost 37% in 2021, which is largely due to the Discretionary Global Macro Strategy achieving a return of almost 70%. To nobody’s surprise, cryptocurrency strategies performed best in 2021. The SMC Cryptocurrency Strategy Index gained more than 212% in 2021. In the space, it was most important to hold a diversified account of cryptocurrencies to achieve such a great return, as Bitcoin (BTC) gained only 60%. The most successful strategies in the space focused on riskier tokens. The Token and Token Liquid strategies gained 295% and 385% respectively. Despite the great results of 2021, the gains are still inferior to the 342% in 2020. The developments in the crypto space will be discussed in a further paragraph. Lastly, another indicator that the industry is in a healthy state is the fact that the number of launches substantially exceed the liquidations and the number of active funds has reached an all-time high of 22,081. 
|
|
 RSS Feed

|
|
|
Stone Mountain Capital LTD is authorised and regulated with FRN: 929802 by the Financial Conduct Authority (‘FCA’) in the United Kingdom. The website content is neither an offer to sell nor a solicitation of an offer to buy an interest in any investment or advisory service by Stone Mountain Capital LTD and should be read with the DISCLAIMER. © 2024 Stone Mountain Capital LTD. All rights reserved. |