23095052321715661284394680

  Stone Mountain Capital - Alternative Investment Advisory
  • About
    • Partners
    • Ventures
  • Team
    • Oliver Fochler
    • Ashvin Chotai
    • Pascal Hasler
    • Alexander Rothlin
    • Claudio Calonder
    • Joaquin Abos
    • Alliances
  • Advisory
    • Corporate Finance
    • Solutions
    • Mandates
  • Research
    • Perspective Subscription
    • News
    • Awards
  • Contact
    • Privacy Policy
    • Anti-Bribery Policy
    • UK Stewardship Code
    • ESG Policy
    • Disclaimer
  • Login

alternative market update h1 2020

29/7/2020

 
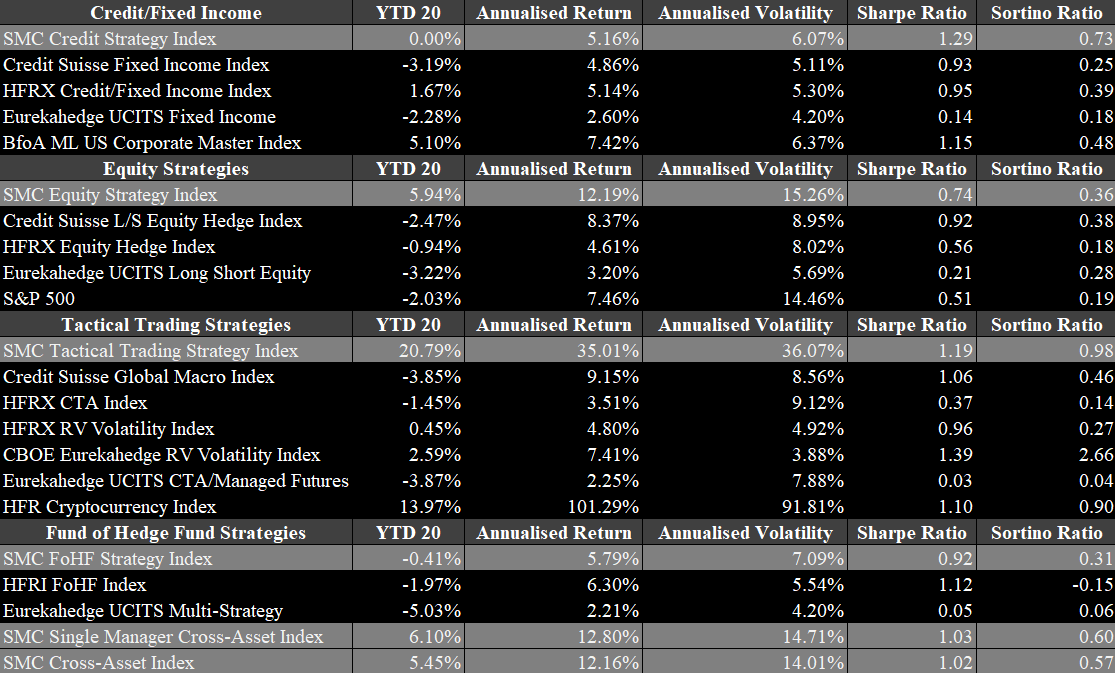
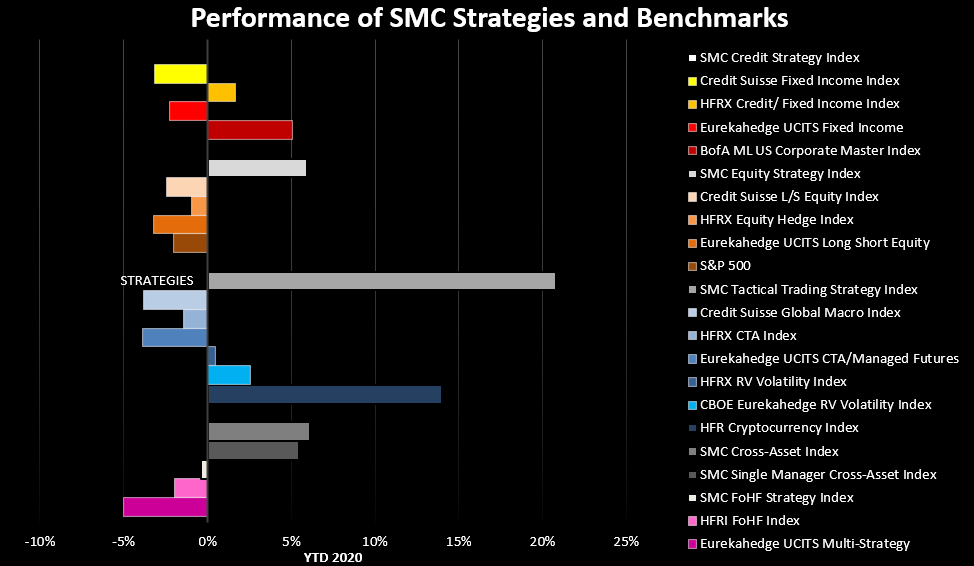
The SMC equity strategy index is up 5.94% in 2020 and outperformed all of its benchmark indices by more than 5%. The credit strategies were suffering and just recovered from their level of end 2019. The SMC tactical trading strategy index did very well in this turbulent environment and is up more than 20% in 2020, whereas most benchmarks are between -4% and 3% except the HFR cryptocurrency index. Our fund of hedge fund strategies were struggling as well and are still down 0.41% for the year, despite their outperformance of benchmark indices. The SMC cross-asset and single manager indices are up more than 5% in 2020. The best performing individual strategy is Discretionary Global Macro, which is up approximately 40% in 2020, despite a loss almost 10% in June 2020. Similarly, the best performing equity strategy is Market Neutral Equity US Algo with a YTD of 27.89%. 
Picture
Further equity strategies that performed very well are Long/Short US Equity Consumer, TMT, Healthcare with a YTD of 26.76% and Long/Short US Equities Disruptive Technologies with 25.90% return in 2020. Further details are found in the table below the summary of H1 2020.
Picture
Table: Performance of Stone Mountain Capital Indices Compared with Benchmarks, Source: Stone Mountain Capital Research, July 2020
Picture
Figure: Performance of Stone Mountain Capital Indices Compared with Benchmarks, Source: Stone Mountain Capital Research, July 2020
*|MC_PREVIEW_TEXT|*
RESEARCH PERSPECTIVE VOL. 136
July 2020
Alternative Markets Update H1 2020
During H1 2020, there were many unprecedented worldwide events caused by Covid-19. Despite the tremendous impact on financial markets, the effect on daily lives has been even bigger. The virus caused lockdowns around the world and introduced a “new normal”, including social distancing and wearing masks in public places. Covid-19 originated at the end of last year in China and has since then spread around the world. Currently, the virus is at its highest number of daily transmissions, despite severe limitations issued by governments around the globe. The crisis started in mid-February 2020 as Covid-19 reached Italy and spread like a wildfire. As a consequence, the financial market faced a decline it has never seen before, with equity markets dropping approximately 30% in a few weeks, even though central banks assisted with trillions of dollars to diminish the downfall. Interest rates in developed countries are now at 0%, with some outliers being slightly above or below. An overview of the macroeconomic environment is given below. Afterwards, the impact on alternative asset classes, such as hedge funds, private equity, private debt and real estate is assessed.
Macroeconomic Environment
In response to the immediate collapse in the equity markets, centrals banks have intervened quickly and pumped trillions of dollars into the economy. The Fed alone used $14tn to stabilize the economy. As a result, global interest rates fell rapidly and are now close to 0%, some even below 0%. Figure 1 shows various graphs regarding global interest rates. The largest drop was experienced in the US, as their rates were substantially higher before the crisis occurred, especially when looking at the comparison of the yield curves now and one year ago. The US treasury yield curve was between 1.8% and 2.5% in July 2020, whereas now it is just barely over 0% for the 1-month treasury bill and at 1.25% for the 30-year treasury note. Figure 2 shows the global government debt yields compared to the Japanese government yields. Global yields are now approximately at the same rate as Japan has been for years, which is sometimes referred to as “Japanification”. The record money printing caused several impacts in other financial markets. Equity markets have quickly rebounded, despite the general bad outlook for the economic environment as a whole, as unemployment has risen steeply and companies are reporting bad corporate earnings. Furthermore, the money printing caused an emerging fear of inflation.
 
Figure 1: Global Interest Rates and Comparison to Previous Year, Source: Barron’s Statistics & Tradeweb ICE US Treasury Close, July 2020
Figure 2: Comparison of Global Government Bond Yields Excluding Japan with Japanese Government Debt Yields, Source: BofA Global Research & ICE Data Indices, July 2020
Because of the money printing, assets that are seen as inflation hedges are steeply on the rise. Gold has been on the rise for almost a year now, as shown in figure 3. The origin of the rally was started by the US-China trade war and the potential uncertainty caused by it. The recent steep rise is caused by the huge amount of money that was printed to stabilize the markets in this current crisis. During the last several months, major banks have corrected their gold target price upwards, currently it is expected that gold will rise above $2,000 per ounce at the end 2020. Figure 4 shows the current bull run of gold in comparison to other gold runs from the past. At the level gold is currently, it is way below other bull runs from the past indicating a potential high upward trend that was entered in 2020 especially. In the short-term future, gold is likely to increase its value due to the economic environment. Currently gold is experiencing one of its fastest gains, as it just surpassed the $1,900 mark and is at $1,941 as of 27th July 2020. More recently, as a consequence of gold gaining so much value, silver has also experienced a surge. Figure 5 shows the historic bull runs of silver. In comparison to gold, which is already in a longer bull run, silver just started and has never gained as much value in such a short time, as during this crisis. Figure 6 shows the gold silver ratio over several time intervals. Since around mid-July the ratio has dropped significantly and has just reached its lowest point within the last year. The ratio has been tumbling around 75 during the last five years. The ratio reached a high of above 120 at the beginning of the crisis and fell back to around 85 at the end of July.
Figure 3: Gold Price per Ounce from July 2019 to July 2020, Source: World Gold Council, July 2020
Figure 4: An Overview of Major Gold Bull Runs in the Past, Source: Katusa Research & Andrews Gwynne, July 2020
Figure 5: An Overview of Major Silver Bull Runs in the Past, Source: Katusa Research & Andrews Gwynne, July 2020
Figure 6: Gold Silver Ratio with Time Horizons from 30 Days to 10 Years, Source: Kitco & Andrews Gwynne, July 2020
Hedge Funds
Hedge funds started well in the year 2020 with a record AuM of $3.66tn. However, the impact of Covid-19 has caused the worst month in history in March 2020 with an average loss of more than 10%. The struggle continued in April, during which the first strategies, such as long/short equities, started to rebound already, while other strategies, predominately fixed income, still had tremendous issues. The AuM of the industry dipped below $3tn during April 2020 and got back to above to $3tn again in May 2020. Figure 7 shows the development of the AuM and quarterly asset flows. The asset flows are an issue in the industry since well over a year now, as the industry continuously faces more outflows than inflows. Q1 2020 was another quarter with net outflows of almost $50bn. These outflows paired with the worst month the industry has ever seen caused a substantial loss in the AuM, which declined by more $300bn in Q1 2020. As the industry started to rebound again in April and May, hedge funds have seen positive net flows. Nonetheless, the industry net flows of the year are still down $75bn and in June there were again more redemptions than inflows. Despite the virus, many hedge funds have bounced back and are now within an interval of -5% to 5% depending on the strategy. Figure 8 shows the returns of different strategies. CTAs were basically unaffected by the crisis. Macro and relative value strategies took a small hit with approximately 5% and were back at their pre-crisis levels in May 2020. The remaining strategies fell up to 25% from their highs in 2019. Most strategies were able to recover most of their losses until May with the exemption of credit strategies. Equity strategies rebounded especially strong compared to other strategies due to the central bank interventions. However, equity hedge funds have failed to deliver their expectations in recent years, as they were frequently outperformed by indices. Figure 9 shows the performance of the S&P 500 compared to the average equity hedge fund strategy. Since 2011, the average equity hedge fund was never able to outperform the S&P 500. Table 1 and figure 10 show our indices compared to other benchmarks. The SMC equity strategy index is up 5.94% in 2020 and outperformed all of its benchmark indices by more than 5%. The credit strategies were suffering and just recovered from their level of end 2019. The SMC tactical trading strategy index did very well in this turbulent environment and is up more than 20% in 2020, whereas most benchmarks are between -4% and 3% except the HFR cryptocurrency index. Our fund of hedge fund strategies were struggling as well and are still down 0.41% for the year, despite their outperformance of benchmark indices. The SMC cross-asset and single manager indices are up more than 5% in 2020. The best performing individual strategy is Discretionary Global Macro, which is up approximately 40% in 2020, despite a loss almost 10% in June 2020. Similarly, the best performing equity strategy is Market Neutral Equity US Algo with a YTD of 27.89%. Further equity strategies that performed very well are Long/Short US Equity Consumer, TMT, Healthcare with a YTD of 26.76% and Long/Short US Equities Disruptive Technologies with 25.90% return in 2020. Further details are found in the table below the summary of H1 2020.
Figure 7: AuM and Quarterly Asset Flows in the Hedge Fund Industry from Q1 2015 to Q1 2020, Source: Preqin, June 2020
Figure 8: Rolling 12-Month Return of Hedge Fund Strategies from January 2018 to May 2020, Source: Preqin, June 2020
Figure 9: Comparison of S&P 500 Performance and Equity Hedge Fund Strategies from 2011 until May 2020, Source: Bloomberg, July 2020
Table 1: Performance of Stone Mountain Capital Indices Compared with Benchmarks, Source: Stone Mountain Capital Research, July 2020
Figure 10: Performance of Stone Mountain Capital Indices Compared with Benchmarks, Source: Stone Mountain Capital Research, July 2020
Cryptocurrencies / Blockchain
Cryptocurrencies have done well during 2020. They started at a relatively low in general in January 2020 and rose substantially until mid-March 2020. The initial outbreak of Covid-19 has increased its values, as Bitcoin (BTC) is frequently compared to gold, and during this time it fulfilled this role. However, on March 12th an Ethereum (ETH) exchange got hacked and there were several transactions for zero USD, which caused ETH to fall sharply. Consequently, other cryptocurrencies dipped strongly as well, as BTC for example dropped from above $8,000 to only $3,800 in a matter of hours. Nevertheless, the currencies recovered quickly and since May, there are relatively stable, for BTC this interval is between $9,000 and $10,000. On 27th July 2020, BTC managed to go over $10,000 since a long time and did not fall back again. Instead BTC is now heading for $11,000. For BTC specifically another major event took place in May, the Bitcoin Halvening, which is a mechanism that cuts the mined Bitcoins into half every four years. It caused significant price increases in anticipation of the event, although afterwards, there was no major shift. This was observable with most halvenings that have taken place so far. Typically, a more substantial spike takes some months. Furthermore, BTC is one of the best performing assets and currencies in 2020 with a YTD of 51.8% (as of July 28th) and outperformed most other cryptocurrencies. ETH is one of the coins that has achieved a better result with an astonishing YTD of 142.8%, more than doubling its value in less than half a year. Despite the good result in 2020, it needs to be reflected that ETH has lost much more value than BTC has since their spikes back in 2017. Cryptocurrencies will play a more important role going forward, as many important conditions for institutional investors are being set. For example, crypto exchanges have developed custodians and have increased their security measures. Cryptocurrencies are getting more and more recognized as a real asset class, rather than as some speculative bet. Additionally, derivatives on cryptocurrencies are available now, which is vital part for institutional investors. Consequentially, BTC has seen more inflows from institutional investors, such as for example Paul Tudor Jones’ hedge fund in early May, which caused BTC to increase by $400 almost immediately. Figure 11 shows the price and market capitalization development of BTC in 2020, with currently trading at 10,937$ with a market capitalization of approximately $201bn (as of July 28th). Figure 12 highlights the same for ETH. ETH is currently trading at $316 with a market capitalization of slightly above $35bn. A major reason for the gains of ETH in 2020 is the huge gain of DeFi (decentralized finance), as the industry’s AUM rose from $2bn at the beginning of July to $4bn towards the end July.
Figure 11: Price and Market Capitalization of BTC in 2020, Source: CoinMarketCap, July 2020
Figure 12: Price and Market Capitalization of ETH in 2020, Source: CoinMarketCap, July 2020
Private Equity
Private equity fundraising has slowed down since the outbreak of the pandemic, as fund managers had to focus on their existing portfolio to get through the crisis well. Moreover, the inability of meeting people in person slowed the entire process down even further, both for funds raising capital but also for funds’ investments. This is especially the case for lesser known and emerging funds. Figures 13 and 14 show the fundraising within the industry. Globally, Q1 2020 was barely affected by Covid-19, as the industry tends to slow down in the first quarter of the year. However, in Q2, during which it typically gains again, it declined further. In Q4 2019 approximately $225bn were raised, whereas in Q1 and Q2 together only around $270bn were raised globally. The slowdown of the industry is also observable by the fact, that only 39% of funds reached their target size within one year in 2020, whereas more than 50% have achieved this back in 2019. The US, which accounts for more deal activity and volume than any other country, has raised $101bn in the first half of 2020 compared to more than $300bn in 2019. Especially when considering that the first quarters was little affected by the virus, the year’s outlook may look grim. The industry’s capital targeted has decreased in 2020 to $884bn in H1 2020 compared to 2019 with $926bn, as shown in figure 15. However, the number of funds has risen to 3,754 in H1 2020 compared to 3,524 at the beginning of 2020, which is an opposite movement to the trend of consolidation in the other graphs. Buyout fund still account for the major stake of capital in the industry with being responsible for 44% of the industry’s capital. Most of the funds focus on venture capital with almost 60%. Nevertheless, all those funds only account for only 22% of total capital. Regarding potential investments in the next 12 months, there was a shift towards smaller investments compared to last year. In Q2 2019, 22% of investors committed more than $300m, whereas this number halved in Q2 2020 to only 11%. Figure 16 shows the AuM of the industry alongside its dry powder and unrealized value. The industry is gaining strongly since 2016, where it was around $2.5tn. At the end of 2019, the industry’s AuM has risen to $4.5tn. The dry powder in the industry has risen continuously as well. Currently, almost $1.5tn of the industry’s capital is in the dry powder, signalling that there is a lot capital to be committed. It is expected that this number will grow further in the near future, despite the virus having a significant impact on fundraising. Nevertheless, capital commitments of funds are also less likely, as there are less meetings in person possible and the entire investment process is certainly much slower nowadays. So far, the most common implication of the virus seems to be that previously existing trends are accelerated. For most asset classes, there is a trend of consolidation towards bigger and fewer funds. Figure 17 shows this acceleration strongly for the private equity funds, especially when looking at the median fund. In 2020, the median size of a funds has more than doubled to $531m compared to $230 at the end of 2019.
Figure 13: Global Fundraising and Numbers of Funds Closed from Q1 2015 to Q2 2020, Source: Preqin, July 2020
Figure 14: Fundraising in the US and Number of Funds Closed from January 2006 until End of June 2020, Source: Pitchbook, July 2020
Figure 15: Number of Funds Raising and Aggregated Capital of the Industry, Source: Preqin, July 2020
Figure 16: Dry Powder and AuM of the Private Equity Industry from December 2009 to December 2019, Source: Preqin, July 2020
Figure 17: Comparison of Average and Median Size of Private Equity Funds, Source: Pitchbook, July 2020
Private Debt
Private debt funds were hit by the crisis in Q1 2020 already. Since then, the industry’s outlook has increased again, as specific strategies such as special situations and distressed debt are of special interest in such environments. Figure 18 shows the fundraising within the industry. The trend in fundraising seems to continue, as it was commonly seen in regards with the virus, with the effect of simply accelerating such a trend. In Q1 2020, $22bn were raised, whereas in Q2 2020, this number already rose back to $34bn. Most of this capital is raised by North America with 69% and Europe with 26%. The strategies this capital is allocated to are mostly special situations with $12.2bn, distressed debt with $9.7bn and direct lending $9bn. In a relatively stable environment, direct lending is typically by far the most invested strategy. Figure 19 shows the AuM of the industry split by investment strategy. The total AuM of the industry is at $854bn as of end 2019. $584bn are unrealized value, whereas the remaining $270bn is the available dry powder in the industry. The most common strategy is direct lending, which has reached a new record high of $314bn and is followed by distressed debt, mezzanine and special situations. The expected allocations towards the industry has barely shifted since Q2 2019 compared to Q2 2020. The number of investors in only one fund has increased by 3% to 67%. Nonetheless, the search for more than four funds has increased by 4% as well to a total of 14%. Regarding the committed capital, there was a major shift. Allocations below $50m have decreased tremendously from 64% in Q2 2019 to only 37% in Q2 2020. Investments above $50m and below $600m have increased. The investments between $100m and $299m have increased the most with a jump to 34% in Q2 2020 from only 18% in Q2 2019.
Figure 18: Fundraising and Number of Funds Raising from Q1 2015 to Q2 2020, Source: Preqin, July 2020
Figure 19: AuM and Dry Powder of the Industry at the End of 2019, Source: Preqin, 2019
Real Estate
The private real estate market saw a decline in Q1 2020, which continued even stronger in Q2 2020. In general, the virus caused an acceleration in already existing trends within the industry, for example the shift from retail towards industrial is boosted by the thriving e-commerce business. The multi-family sector is also seeing an increase, as people tend to spend more time at home than before. Especially as in the US for example, rent prices going up on the coast, financial centres and tech hubs. By the nature of the crisis, the hospitality sector was hit hardest by the pandemic mostly due to travel bans and restrictions. The AuM of the entire private real estate industry has diminished by $8bn during 2020 and is currently at $273bn, as shown in figure 20. The number of funds raising capital has slightly decreased to 903. The industry failed to continue its hugely successful year 2019. From 2019 to 2020, the industry grew by 28% from $219bn to $281bn. Figure 21 shows the fundraising within the industry from 2015 until H1 2020. Fundraising levels in the real estate industry remained at a stable level at around $40bn with some variations. However, the industry tanked substantially in Q4 2019 with a drop to below $30bn. However, despite the virus, fundraising has increased in both Q1 and Q2 2020 and is now back at $40bn. The number of funds has drastically decreased in the last year. In Q3 2019, there were more than 120 funds raising capital, whereas in Q2 2020 only 50 are seeking capital. The outlook for the industry is less positive than the development in AuM and fundraising given the economic environment. Fundraising is likely to drop substantially, as the projection of committed capital from investor within the next 12 months is less optimistic. In Q2 2019, 52% of investors planned to commit to one fund and 20% to more than four funds. This has strongly shifted in Q2 2020, as 77% of investors are now planning with one fund and only 8% think of four or more funds. Nevertheless, the size of the commitments looks more promising, as the commitments of above $600m have doubled to 18% in the recent year according to figure 22. Smaller investments have also risen by almost 10% and are adding up to 70% of investments, which are below a size of $100m. Regarding strategies, the interest in less risky strategies decreased, causing increased interest in core-plus, value added, opportunistic and distressed strategies with higher expected yields during stressed market environments. Lastly, the deal flow of private equity real estate (PERE) is probably the biggest issue of the industry, as it has completely collapsed, as shown in figure 23. In Q4 2019, the aggregated capital involved was $120bn with almost 2,500 deals. These numbers declined to $78bn and 1,904 deals in Q1 2020 and to $30bn and 988 deals in Q2 2020. These numbers are tremendously low, the results of Q2 2020 are almost only half of the volume in the last low in 2015.
Figure 20: Number of Funds and AUM of the Private Real Estate Industry from January 2016 to July 2020, Source: Preqin, July 2020
Figure 21: Number of Funds Closed and their Aggregated Capital Raised in $bn from 2015 to H1 2020, Source: Preqin, July 2020
Figure 22: Comparison of Expected Capital Commitments over the next Year in Q2 2019 and Q2 2020, Source: Preqin, July 2020
Figure 23: Deal Flow of PERE from Q1 2015 to Q2 2020, Source: Preqin, July 2020
STONE MOUNTAIN CAPITAL
Stone Mountain Capital is an advisory boutique established in 2012 and headquartered in London with offices Pfaeffikon in Switzerland, Dubai and Umm Al Quwain in United Arab Emirates. We are advising 30+ best in class single hedge fund and multi-strategy managers across equity, credit, and tactical trading (global macro, CTAs and volatility). In private assets, we advise 10+ sponsors and general partners across private equity, venture capital, private credit, real estate, capital relief trades (CRT) by structuring funding vehicles, rating advisory and private placements. As of 7th July 2020, Stone Mountain Capital has total alternative Assets under Advisory (AuA) of US$ 56.1 billion. US$ 44.6 billion is mandated in hedge funds and US$ 11.5 billion in private assets and corporate finance (private equity, venture capital, private debt, real estate, fintech). Stone Mountain Capital has arranged new capital commitments of US$ 1.61 billion across hedge fund, private asset and corporate finance mandates and has been awarded over 35 industry awards for research, structuring and placement of alternative investments. As a socially responsible group, Stone Mountain Capital is a signatory to the UN Principles for Responsible Investing (PRI). Stone Mountain Capital applies Socially Responsible Investment (SRI) filters to all off its alternative investment strategies and general partners on behalf of investors. 
 
Our Team   Our Solutions   Our Mandates   Our Research   Our News


Contact

We are able to source any specific alternative investment search and maintain relationships with dozens of best-in-class hedge fund managers, private equity and private debt general partners (GPs) and real estate and infrastructure developers. We don’t pass any costs on to our investors, since our compensation comes from our mandated managers, GPs and developers. Please contact us, should you require further information about our solutions.  

Twitter
LinkedIn
Facebook
Website
Email
Schedule a call with the team
Main UK Tel.: +44 207 268 4905
Main UAE Tel.: +971 4383 5386
We have updated our privacy policy to take into account the new requirements of the GDPR. Please take some time to read the policy, which explains what personal data we collect, why we collect it, how we use it and other relevant information. You can review our privacy policy here, our anti-bribery policy here and our commitment to the UK stewardship code here. Stone Mountain Capital LTD is registered (Reference: ZA589246) in the data protection public register of the Information Commissioner's Office ('ICO') in the United Kingdom.

No action is required if you wish to remain in contact, however please reply if you want your details removed by contacting us at info@stonemountain-capital.com or by using the unsubscribe button below. In case this newsletter has been forwarded to you and you want to subscribe, please click here.

Stone Mountain Capital is a limited company (LTD) registered in England & Wales with registered number 8763463. The registered address is: One Mayfair Place, Devonshire House, Mayfair, London W1J 8AJ, England, United Kingdom. Stone Mountain Capital LTD is registered (FRN: 729609) as Appointed Representative with the Financial Conduct Authority (‘FCA’) in the United Kingdom. Stone Mountain Capital LTD is the Distributor of foreign collective investment schemes distributed to qualified investors in Switzerland. Certain of those foreign collective investment schemes are represented by First Independent Fund Services LTD, which is authorised and regulated by the Swiss Financial Market Supervisory Authority (‘FINMA') as Swiss Representative of foreign collective investment schemes pursuant to Art 13 para 2 let. h in the Federal Act on Collective Investment Schemes (CISA). Stone Mountain Capital LTD conducts securities related activities in the U.S. pursuant to a Securities and Exchange Commission ('SEC') Rule 15a-6 Agreement with Crito Capital LLC, a U.S. SEC registered broker-dealer, and member of Financial Industry Regulatory Authority (‘FINRA’), Securities Investor Protection Corporation (‘SIPC’) and Municipal Securities Rulemaking Board (‘MSRB'). Stone Mountain Capital FZE is registered at: Business Center, Al Shmookh Building, Umm Al Quwain Free Zone, Umm Al Quwain, United Arab Emirates. All information in this perspective including research is classified as minor acceptable non-monetary benefits ('MNMB') in accordance with article 11(5)(a) of the MiFID Delegated Directive (EU) 2017/593 and FCA COBS 2.3A.19.

Copyright © 2020 Stone Mountain Capital LTD. All rights reserved.
Any business communication, sent by or on behalf of Stone Mountain Capital LTD or one of its affiliated firms or other entities (together "Stone Mountain"), is confidential and may be privileged or otherwise protected. This e-mail message is for information purposes only, it is not a recommendation, advice, offer or solicitation to buy or sell a product or service nor an official confirmation of any transaction. It is directed at persons who are professionals and is not intended for retail customer use. This e-mail message and any attachments are for the sole use of the intended recipient(s). Our LTD accepts no liability for the content of this email, or for the consequences of any actions taken on the basis of the information provided, unless that information is subsequently confirmed in writing. Any views or opinions presented in this email are solely those of the author and do not necessarily represent those of the limited company. Any unauthorised review, use, disclosure or distribution is prohibited. If you are not the intended recipient, please notify the sender by reply e-mail and destroy all copies of the original message and any attachments. By replying to this e-mail, you consent to Stone Mountain monitoring the content of any e-mails you send to or receive from Stone Mountain. Stone Mountain is not liable for any opinions expressed by the sender where this is a non-business e-mail. Emails are not secure and cannot be guaranteed to be error free. Anyone who communicates with us by email is taken to accept these risks. This message is subject to our terms at our Disclaimer.
 

Comments are closed.
    British Pound Exchange Rate
    Tweets by @stonemountainuk
    Tweets by @stonemountainch
    Tweets by @stonemountainae
    Tweets by @stonemountaincp
    Tweets by @stonemountaincp
    Tweets by @OliverFochler
    Tweets by @ChotaiAshvin
    Tweets by @hasler_pascal


    ​Archives

    January 2023
    December 2022
    November 2022
    October 2022
    September 2022
    August 2022
    July 2022
    June 2022
    May 2022
    April 2022
    March 2022
    February 2022
    January 2022
    December 2021
    November 2021
    October 2021
    September 2021
    August 2021
    July 2021
    June 2021
    May 2021
    April 2021
    March 2021
    February 2021
    January 2021
    December 2020
    November 2020
    October 2020
    September 2020
    August 2020
    July 2020
    June 2020
    May 2020
    April 2020
    March 2020
    February 2020
    January 2020
    October 2019
    September 2019
    August 2019
    July 2019
    June 2019
    April 2019
    January 2019
    November 2018
    August 2018
    May 2018
    February 2018
    December 2017
    November 2017
    October 2017
    June 2017
    March 2017
    February 2017
    January 2017
    November 2016
    October 2016
    August 2016
    July 2016
    June 2016
    May 2016
    April 2016
    March 2016
    February 2016
    January 2016
    December 2015
    November 2015

    Categories

    All
    Bitcoin
    Blockchain
    China
    Corporate
    Credit
    Cryptocurrency
    CTA
    Direct Lending
    Emerging Markets
    Equity
    ETF
    Ethereum
    Fund Of Hedge Fund
    Global Macro
    Hedge Fund
    Index
    Middle Market
    Private Debt
    Private Equity
    Rating
    Real Estate
    Risk Premia
    SME
    State Owned Enterprise
    Stocks
    UCITS
    Venture Capital
    VIX
    Volatility
    VSTOXX

    RSS Feed

PRIVACY POLICY
ANTI-BRIBERY POLICY
UK STEWARDSHIP CODE
CONTACT
DISCLAIMER
ESG POLICY
Picture

​Stone Mountain Capital LTD is authorised and regulated with FRN: 929802 by the Financial Conduct Authority (‘FCA’) in the United Kingdom. 
The website content is neither an offer to sell nor a solicitation of an offer to buy an interest in any investment or advisory service by​
Stone Mountain Capital LTD and should be read with the DISCLAIMER.
© 2023 Stone Mountain Capital LTD. All rights reserved.
  • About
    • Partners
    • Ventures
  • Team
    • Oliver Fochler
    • Ashvin Chotai
    • Pascal Hasler
    • Alexander Rothlin
    • Claudio Calonder
    • Joaquin Abos
    • Alliances
  • Advisory
    • Corporate Finance
    • Solutions
    • Mandates
  • Research
    • Perspective Subscription
    • News
    • Awards
  • Contact
    • Privacy Policy
    • Anti-Bribery Policy
    • UK Stewardship Code
    • ESG Policy
    • Disclaimer
  • Login