
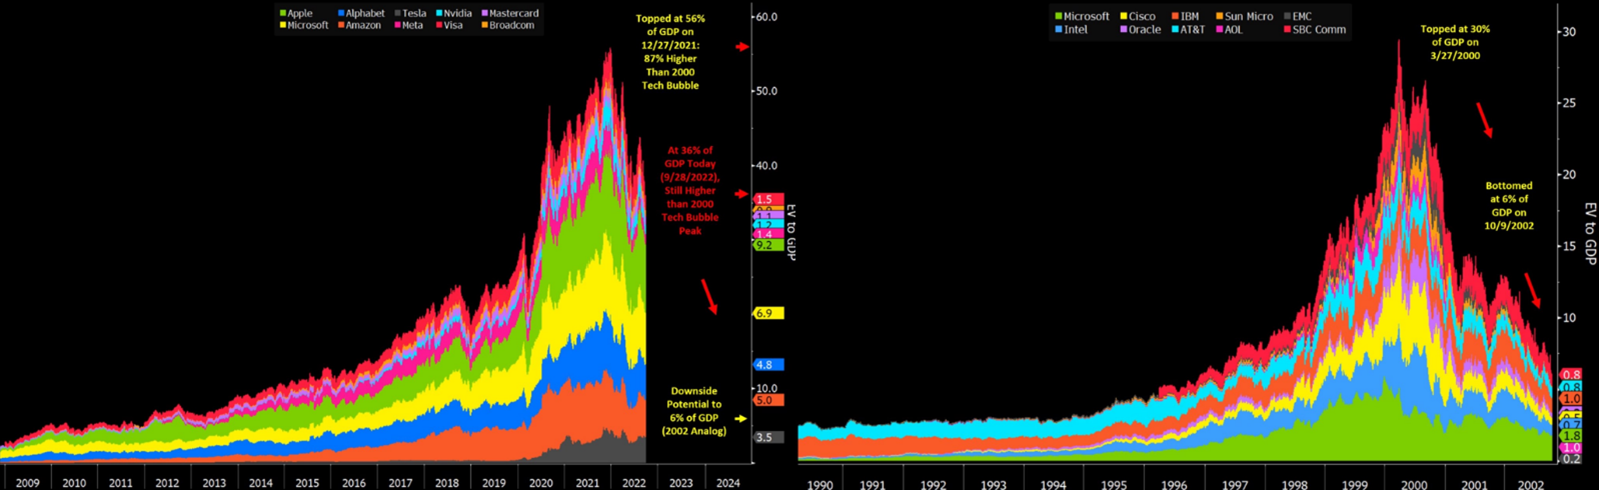
For once, inflation was not the most prominent topic over the past two weeks. Instead, it’s the UK government and its optimistic tax cut. The UK’s new prime minister Truss promised a large tax cut in her election campaign. If implemented, the tax cuts would lead to losses of around £40bn and would be the second-highest budget cut in the past 50 years. Figure 1 shows a breakdown of the largest budget adjustments over the past 50 years. This seems very optimistic given the already existing struggles with ever-soaring inflation at the 10% mark and the severe gas/oil crisis in Europe. When further details on its implementation were revealed, the UK economy faced severe issues and could only narrowly avoid a complete disaster. The British Pound almost dropped to an equivalent level to the US Dollar for short time. Especially, the bond market crashed, as the BoE initially wanted to step back its bond buying program introduced after Covid-19. Figure 2 shows the drop in the value of UK gilts with maturities exceeding 15 years. Although they have been declining since 2020, the most recent drop is substantial. Currently, UK gilts are down 54%. A complete crash could only be avoided by the BoE strongly intervening in the bond market to stabilize the situation. It is very unlikely that the BoE can afford to step back its bond buying program any time soon, as the risk of fire sales is large, especially, if market participants know that UK gilts are no longer stabilized by the BoE. With rampant inflation across the world, central banks are continuing their consistent and strong hikes to combat further rising inflation. These interest rate hikes have led to substantial bond yield increases. The G7 average 10-year bond yields have now surpassed their average yield of the past two decades, as shown in Figure 3. Given the current development, bond yields could rise to their average at the beginning of the 21st century and likely stay there for a while until inflation is under control to a large degree. While it is debatable whether central banks acted fast or not; when they started doing so, the frequency and magnitude were substantial. This is especially true for the Fed. Figure 4 shows a comparison of the speed and magnitude of the current hikes compared to other historical hike cycles. With the current expectation of two further hikes (each between 50bps and 75bps), the current cycle is not only the largest in terms of magnitude but also the fastest at any given time. Despite the strong hikes of the Fed already, inflation in the US still increased by 0.4% to 8.2%, which was higher than expected and is likely to put further pressure on the Fed. This development is likely to emphasize further rate hikes, potentially even higher than currently anticipated. Equities also continue to be under pressure. After reaching their low of the year in mid-2022, they bounced back until August 2022. Since then, they have been consistently facing losses and reached new lows in 2022. The S&P 500 index is down 25% YTD, while the tech-heavily Nasdaq is down almost 35% YTD. The outlook is certainly not great with rising interest rates and a looming global recession. Additionally, it is worrying that the Covid-19-induced bull run strongly resembles the development during the dot-com bubble. Figure 5 highlights the similarities between the two tech bull runs and potentially bubbles.
Comments are closed.
|
|


 RSS Feed

|
|
|
Stone Mountain Capital LTD is authorised and regulated with FRN: 929802 by the Financial Conduct Authority (‘FCA’) in the United Kingdom. The website content is neither an offer to sell nor a solicitation of an offer to buy an interest in any investment or advisory service by Stone Mountain Capital LTD and should be read with the DISCLAIMER. © 2024 Stone Mountain Capital LTD. All rights reserved. |