23095052321715661284394680

  Stone Mountain Capital - Alternative Investment Advisory
  • About
    • United Arab Emirates
    • Estonia
    • Partners
    • Ventures
  • Team
    • Oliver Fochler
    • Ashvin Chotai
    • Pascal Hasler
    • Alexander Rothlin
    • Claudio Calonder
    • Joaquin Abos
    • Alliances
  • Advisory
    • Corporate Finance
    • Solutions
    • Mandates
  • Research
    • Perspective Subscription
    • News
    • Awards
  • Contact
    • Privacy Policy
    • Anti-Bribery Policy
    • UK Stewardship Code
    • ESG Policy
    • Disclaimer
  • Login

alternative markets Review 2020 & 2021 Crypto predictions

8/2/2021

 
Picture
​Alternative Markets Review 2020
2020 will be certainly a year nobody will not forget very fast. The most notable event was certainly Covid-19 and its tremendous impact on the everybody in the entire world. From a financial perspective, there were so many exceptional phenomena that occurred as a consequence of Covid-19. Firstly, national banks have intervened in the market to an extent that was unprecedented, the FED above all. The huge interventions of the FED through quantitative easing in GFC in 2008 were next to nothing to the interventions following Covid-19. The common measures of national banks in particular adjusting interest rates was exerted quickly, which led to the interventions through other channels as described previously. Almost all industrialized countries are now facing interest rates that are negative or very close around 0%, including a yield curve inversion in the US during the pandemic. Governments have also provided huge sums of financial aids for the economy to fight Covid-19, which led to record level of governmental debt. In the US, the debt level is almost as high as during WW2, which says a lot. Low interest rates fuelled the rally of safe haven asset such as gold further, which had a great year, despite having gained already a lot in 2019 from the trade war between the US and China.
Hedge Funds
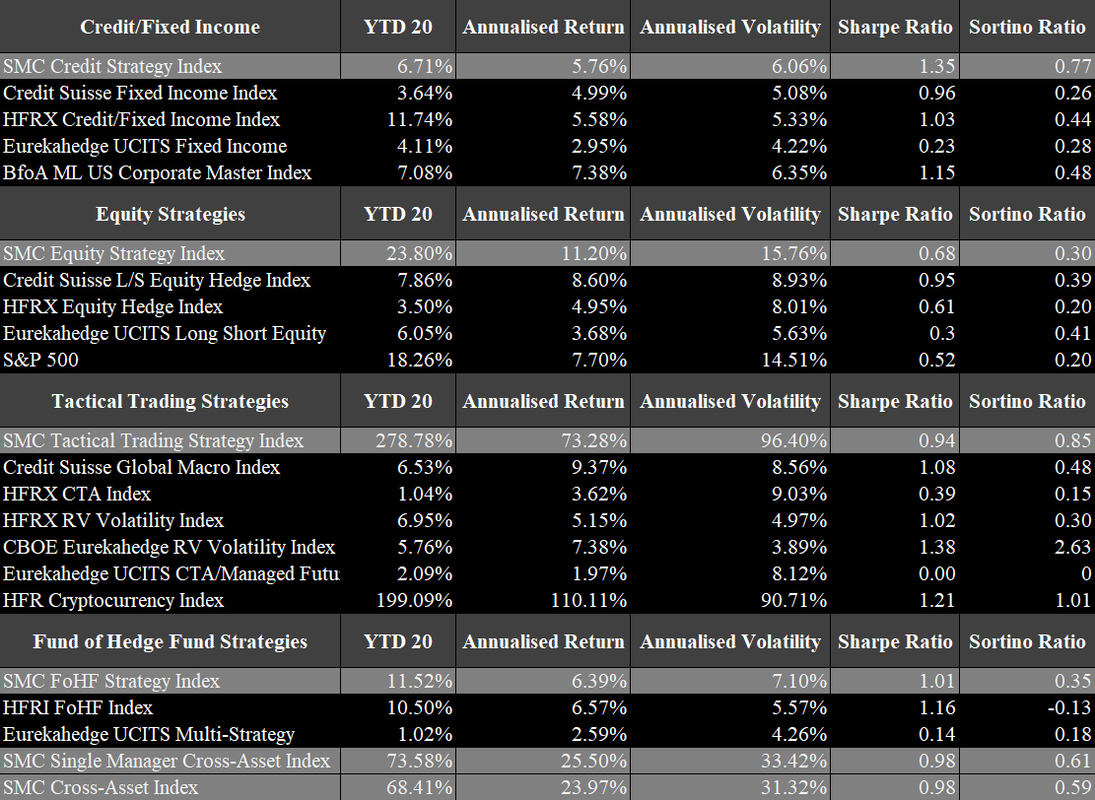
Hedge funds had a great 2020, despite the severe drawdowns in March and April. Preqin reports that the average hedge fund achieved a YTD in 2020 of 16.69%. Figure 4 shows an overview of the returns of our hedge funds across fixed income, equity, tactical trading and fund of hedge funds (FoHF) strategies. Over all categories, our average hedge fund is up 68% in 2020, largely driven by crypto hedge funds which posted stellar returns as cryptocurrencies, which will be discussed in the part. Our tactical trading strategies are up 279% in 2020, as of most of those strategies are crypto-related. The equity-based hedge funds achieved a YTD of 23.8% in 2020, which a substantial variance across the hedge funds, largest based on the strategy pursued. Fixed income-based hedge funds struggled longer in 2020, as both equity and tactical trading strategies recovered very fast. Fixed income strategies are up 6.7% in 2020. Figures 5 to 8 show the performance of the strategies compared to respective benchmarks.
Picture
Picture
Picture
Picture
Picture
*|MC_PREVIEW_TEXT|*
RESEARCH PERSPECTIVE VOL. 148
February 2021
Alternative Markets Review 2020
2020 was a year to remember due to the Covid-19 pandemic and its impact on the world. From a financial markets perspective, there were so many exceptional phenomena that occurred as a consequence of Covid-19. Firstly, central banks have intervened in markets to an unprecedented extent, the FED above all. The huge interventions of the FED through quantitative easing in GFC in 2008 were next to nothing to the interventions following Covid-19. Common measures of central banks in particular adjusting interest rates was exhausted quickly, which led to interventions through other channels as described previously. Almost all industrialized countries are now facing interest rates that are negative or very close around 0%, including yield curve inversion in the US during the pandemic and now a steepening of the curve. Governments have also provided huge sums of financial aids for the economy to fight Covid-19, which led to record level of governmental debt. In the US, the debt level is almost as high as during WW2, which says a lot. Low interest rates fuelled the rally of safe haven asset such as gold further, which had a great year, despite having gained already a lot in 2019 from the trade war between the US and China. The price development of gold is shown in Figure 1 below.
Figure 1: Gold Price per Ounce in USD from January 2019 to February 2021, Source: Gold Hub, February 2021
Even more interesting was the year for oil, whose movements were extreme to say the least. On 20th April 2020, WTI crude futures for May went to -$37 per barrel. At the beginning of the crisis, both WTI and Brent crude were trading below $20 per barrel for a few weeks (with the exception of 20th April). After multiple extraordinary meetings of OPEC+ and the decision to cut production substantially, the oil price recovered and remained fairly stable around $40 per barrel for WTI from June to around November, after which it surged again and is currently trading at $57, around the level it was before Covid-19. Figure 2 shows WTI price over the last year.
Figure 2: WTI Crude Oil Price per Barrel from February 2020 to February 2021, Source: Trading Economics, February 2021
The stock market was another phenomenon to watch in 2020. The stock market suffered significantly when Covid-19 hit in mid-March 2020 but after a month, the bull run started again which is still ongoing, despite the huge economic damage the virus has caused. It seems that the stock market is moving complete unaffected by the current economic conditions. In particular tech companies, such as Amazon and Apple had a great year. However, the most extraordinary development was Tesla that achieved a YTD of more than 700% in 2020, outperforming even cryptocurrencies by a huge margin, and making Elon Musk to the wealthiest person on earth. Figure 3 shows the S&P 500 during 2020 and 2021 so far. The S&P 500, similar as most other major US indices, traded at a record high before the pandemic hit. For the S&P 500 this was at 3386 in February 2020. During the early days of the pandemic, the index dropped to just a bit above 2200. However, the stock market recovered very quickly and continuously rose. It even surpassed its previous record high and is currently substantially higher than it ever was with 3887. There are two simple explanations for this development, at least to some degree. Firstly, the money that was pumped into the economy by the FED and other central banks. Secondly, with interest rates being close to zero or even negative, there is a lack of investment opportunities, which increases the capital committed in the stock market.
Figure 3: S&P 500 during the Last Year, Source: WSJ Markets, February 2021
In the following paragraphs is a more detailed breakdown of how 2020 affected hedge funds, cryptocurrencies, private equity and venture capital, private debt and real estate as well as some further insights in ESG.
Hedge Funds
Hedge funds had a great 2020, despite the severe drawdowns in March and April. Preqin reports that the average hedge fund achieved a YTD in 2020 of 16.69%. Figure 4 shows an overview of the returns of our hedge funds across fixed income, equity, tactical trading and fund of hedge funds (FoHF) strategies. Over all categories, our average hedge fund is up 68% in 2020, largely driven by crypto hedge funds which posted stellar returns as cryptocurrencies, which will be discussed in the part. Our tactical trading strategies are up 279% in 2020, as of most of those strategies are crypto-related. The equity-based hedge funds achieved a YTD of 23.8% in 2020, which a substantial variance across the hedge funds, largest based on the strategy pursued. Fixed income-based hedge funds struggled longer in 2020, as both equity and tactical trading strategies recovered very fast. Fixed income strategies are up 6.7% in 2020. Figures 5 to 8 show the performance of the strategies compared to respective benchmarks.
Figure 4: Summary Table of SMC Indices and a Comparison of Benchmark Indices, Source: Stone Mountain Capital Research, February 2021
Figure 5: SMC Credit / Fixed Income Hedge Funds Returns in Comparison to Benchmark Indices, Source: Stone Mountain Capital Research, February 2021
Figure 6: SMC Equity Hedge Funds Returns in Comparison to Benchmark Indices, Source: Stone Mountain Capital Research, February 2021
Figure 7: SMC Tactical Trading Hedge Funds Returns in Comparison to Benchmark Indices, Source: Stone Mountain Capital Research, February 2021
Figure 8: SMC FoHF Hedge Funds Returns in Comparison to Benchmark Indices, Source: Stone Mountain Capital Research, February 2021
The AuM of the hedge fund industry was on the decline since mid-2018, despite an increase through the gains of hedge funds over this time period. In H1 2018, hedge funds’ AuM was approximately $3.5tn and declined to around $3.2tn in 2019. In March 2020, this value dropped to below $3tn, due to the performance but also a high outflow from investors in hedge funds, as shown in Figure 9. Note that the reported AuM differs quite substantially depending on the source. Hedge funds recovered relatively fast on average and thereby increasing its AuM again. According to HFR, the AuM of hedge funds at the end of 2020 was at $3.6tn, driven by the double-digit performance of most hedge funds and the largest inflow of the decade in hedge funds in November 2020. According to Barclayhedge, over the last ten years, there was positive net inflow of $164bn and over the last three years a net outflow of $283bn. Thus, the inflow in November 2020 of around $170bn was very meaningful in this context. Due to this development as well as the expected market volatility awaiting in 2021, it is likely that the AuM of hedge funds will continue to rise.
Figure 9: Total Assets of Hedge Funds by Performance-based Growth and Net Asset Flows, Source: Eurekahedge, January 2021
Another positive development in the industry is the lowest number of funds closing since 2012, which is surprising due to severe drawdowns in early 2020. The number of fund closures almost halved compared to 2019 for CTAs. For hedge funds in general, the number of liquidations dropped from 852 in 2019 to 777 in 2020. However, the number of funds launched is the lowest number since 2000 with only 502.  Figure 10 summarizes the number of launches and liquidations of CTAs over the last ten years.
Figure 10: Number of Launches and Liquidations of CTAs, Source: Preqin Pro, February 2021
Cryptocurrencies / Blockchain
It is no secret that cryptocurrencies had a great 2020 and continued in a similar fashion in early 2021. Bitcoin (BTC) started the year at around $7.8k and fell to a bit less than $4k on 12th March 2020, after the initial impact of Covid-19 in Western countries. BTC recovered very fast and by May 2020, it surpassed the $10k mark for the first time since a while. Afterwards, it steadily rose until it hit the $20k mark in early December 2020, boosted by several positive news in the institutional investor space. These include major fund managers that changed their mind on BTC and saw its potential, the adoption of derivatives on cryptocurrencies to make the market more efficient and it gained significantly more general acceptance as an asset class rather than an (only) speculative asset. Another example for this is Paypal which allows transactions with BTC. Alongside other similar providers, those companies are buying more than 100% of mined BTC; thus, forcing them to buy BTC from the outstanding supply, which is another indicator for its slowly broad adoption. Moreover, the market environment for BTC was great, as it could prove its initial purpose with the exception of the first few weeks during the pandemic, in which all asset classes correlated. BTC’s was created during the financial crisis in 2008 and the subsequent years, as a critic to the monetary policy adopted by central banks, in particular the money printing. In a crisis, BTC should behave like a safe haven asset, as its supply is limited (21m) and therefore acts as an inflation hedge. More recently, it was more and more compared to gold, as it oftentimes is referred to as “digital gold”. Towards the movement towards the $20k mark, it even went as far as that gold got sold in order to buy BTC. After BTC had surpassed its record high from 2017, it rallied up a bit before it crashed again to about $16k. However, when it reached the $20k mark again, shortly before Christmas, it took only a few days until it reached the $30k mark. In January 2021, this rally continued until it reached the mark of $42k, at which it crashed again to below $30k in the subsequent days. As of the time of writing (5th February 2021), BTC is at around $38k. For the past week, BTC traded with considerable volatility between the $32k to $38k range. Figure 11 below shows the development of the BTC price during 2020 and 2021 so far.

 
Figure 11: BTC Price from January 2020 to February 2021, Source: CoinGecko, February 2021
Another major event that has taken place for BTC is the halvening, which was widely awaited in May 2020, especially due to the spike after the substantial loss in mid-March 2020. The BTC halvening is an event that takes place every four years and cuts the reward for mined BTC in half. In mining, BTC are rewarded for mining a block in the chain. Prior to May 2020, the reward was 12.5 BTC, while it is now 6.25 BTC for approximately the next few years. Theoretically, the price should rise after each of those events as the additional supply mined is cut in half. However, when looking at the halvenings in the past and the associate BTC price, the effect of the halvening is typically only noticeable with a considerable time lag. Nevertheless, the price increases in BTC are substantially higher after a halvening took place compared to before a halvening. This observation is shown in Figure 12 below. This also has an impact on valuation attempts of BTC. BTC does not yet have a widely accepted model for its valuation but there are some attempts. The most common one assumes that the price of BTC doubles on a logarithmic scale every time a halvening takes place. Based on this model, the target price for BTC would be $100k for the remaining 3.5 years and $1m for the next four years. The target price of BTC of $100k is the most communicated target from several institutions and individuals, although they vary in their time at which this target should be reached. Pantera Capital, shown in the graph below, estimates the value of BTC to be around $115k in August 2021, while others are going further with projections of up to $500k.
Figure 12: Rallies of BTC After and Before Halvenings, Source: Pantera Capital, January 2021
Another topic of interest is the market capitalization of cryptocurrencies. The market capitalization of cryptocurrencies has surpassed the $1tn mark at the beginning of 2021, which is higher than certain established asset classes such as CLOs. BTC contributes the largest portion to this development, which is unsurprising. BTC’s market capitalization is currently around $705bn. Ethereum (ETH), by far the second largest cryptocurrency has a market capitalization of $185bn. The remaining capital is committed to the remaining thousands of cryptocurrencies. The Figure below shows the market concentration of cryptocurrency market. It also shows that no other cryptocurrency, aside from BTC and ETH, makes up more than 1%. Oftentimes, the cryptocurrency development in that last year is seen as a second bubble like the one from 2017 and 2018 due to its arguably unsustainable growth during the year. However, there are substantial differences. Firstly, there is the institutional adoption mentioned in the previous paragraphs. Secondly, in 2017, there were many new cryptocurrencies launches on a weekly basis and those made up a significant portion of the total market capitalization as nobody knew which ones were effective worth something and which ones not. Nowadays, this has shifted, as the ones seen as adding value to the economy are now also responsible for the majority of the value of the cryptocurrency market, notably ETH and BTC which account for more than 85% of the total market capitalization.
Figure 13: Market Concentration of the Cryptocurrency Market in December 2017 and January 2021, Source: Pantera Capital, January 2021
ETH experienced a very similar development during the year 2020 as BTC has. Nevertheless, the performance of ETH during 2020 was a lot better than BTC’s. ETH was up 480% in 2020, while BTC was only up 268%. This is largely due to the fact that ETH started the year at a very low level with only $130, while BTC was around $8k. These numbers are especially significant, if you consider them relative to the peak in 2017/ 2018, when ETH was around $1500 and BTC at around $20k. At the end of December 2020, BTC was worth already $29k, 50% above its peak in 2017, while ETH was only at $736, still less than 50% of its peak in 2017. Consequentially, this development continued in 2021 so far with BTC being up 31%, while ETH is up already 119%. Another reason for this surge is certainly that ETH was commonly referred as the most undervalued cryptocurrency at the beginning of 2021. Figure 14 below shows the price development and its strong surge in January 2021. Furthermore, it was certainly beneficial for ETH that ETH 2.0, essentially an updated version of ETH with an increased transaction capability, was launched in early December 2020.
Figure 14: ETH Price from January 2020 to February 2021, Source: CoinMarketCap, February
Another major driver for ETH during 2020 and 2021 was the enormous growth of capital locked in DeFi (decentralized finance). DeFi are financial platforms that are decentralized in comparison to mostly centralized financial platform currently. Typically, DeFi is based on decentralized apps, frequently referred to as dapps. Dapps make use of smart contracts to make financial transaction more efficient, faster and cheaper. At the beginning of 2020, less than $1bn was locked in DeFi, whereas as of February 2021, it already surpassed the $35bn mark. The Figure below shows the development of DeFi over the last year. It is another driver for ETH, as almost every DeFi application is based on ETH rather BTC, due to its advantage of executable transactions per seconds.
Figure 15: Total Value Locked in DeFi, Source: DeFi Pulse, February 2021
Polkadot (DOT) is another cryptocurrency that has picked up steam, especially in early January 2021. It was launched in July 2020 and is already the fifth largest cryptocurrency by market capitalization. Every (serious) cryptocurrency has a value proposition, of why it should it be of use in the future. DOT is unique as its ultimate goal is to make other cryptocurrencies communicate with each other seamlessly. DOT is currently trading at $20.5 and has a market capitalization of $18.6bn, which once again highlights the huge deviation in market capitalization in the crypto space and the large portion of BTC and ETH. Nevertheless, DOT had great returns. In 2020, despite being traded only since July, achieved a YTD of 180% and is up already 156% in 2021.
Figure 16: DOT Price from July 2020 to February 2021, Source: CoinMarketCap, February 2021
Other notable movement in January and February 2021 address Ripple (XRP) and Dogecoin (DOGE), which were heavily boosted by Reddit’s WallStreetBets channel and alike. As a response to the banning of buying meme stocks that were significantly shorted by hedge funds from trading platforms such as Robinhood and others, attempted price spikes of XRP and DOGE. For the case of XRP, the attempt was to place buy orders at a coordinated time to increase the price. This flopped, as XRP dropped from almost $0.75 to below $0.40 within minutes. However, in the days prior to the attempted price spike XRP surge more than 150%. DOGE traded very stable at $0.008 before the end of January and surged to $0.08 within 24 hours. Afterwards, it lost half its gain but remains relatively constant at around $0.04 since then. More on the outlook of the cryptocurrency market in 2021 is found at the end of the writing from Paul Veradittakit from Pantera Capital.
Private Equity / Venture Capital
Private Equity (PE) was mostly resilient to the consequences of Covid-19 in 2020. At the beginning it suffered quite substantially, but the industry has adapted quickly to the new normal without business travel and mostly conducting business via online meetings. One sign of this quite beneficial development in 2020 is that the AuM of the industry rose by 6.1% in 2020 to $4.74tn (as of June 2020). This growth is slightly smaller compared to previous years, but given the circumstances, it is a very good result. Furthermore, a survey from Preqin suggests that 44% of investors are planning to commit more capital to PE and 36% want to commit more to Venture Capital (VC) in the coming twelve months. A major reason for the good year of PE is that the asset class has established itself as core investment class in institutional portfolio, as in North America the median allocation is 6.3% of the AuM of the fund. A core driver this year was that Asia is catching up with this development, raising its median from 3.3% to 5.0%. Asia, in particular China, India and Southeast Asia, are the most promising areas for upcoming investments, both from a fund manager’s side and the investor’s side, as shown in Figure 17. Alongside the growth in AuM, the private equity industry is now sitting on a record dry powder of $1.7tn, due to the difficulties of deploying capital especially in the early times of the pandemic.
Figure 17: Opportunities for PE in 2021 in Emerging Markets, Source: Preqin, November 2020
PE investment activity fell in 2020 with the value in total deals being down 7% from the previous year and is now at $436bn. These results were mostly caused by relatively immediate effect of Covid-19 in second quarter of 2020 as the buyout deal volume dropping from $120bn in Q1 to only $64bn in Q2. Afterwards, it stabilized to some degree. While buyout-based strategies struggled, VC had a stellar year. In 2020 totally $297bn were committed and $391bn were realized through exits. In comparison, its previous high in 2018 was $177bn in inflows. Furthermore, this development will certainly positively impact fundraising in 2021. VC is also the strategic focus that boosts the number of PE’s funds, as shown in Figure 18. VC oriented funds were the driver for the increased number in PE funds since 2012. However, relatively speaking, the contribution of VC has increased continuously, as in 2012 around 40% of PE funds were focused on VC, whereas in 2020 this number rose to approximately 65%. Other strategies, such as buyout, growth and PE fund of funds contribute equally to the number of funds in PE. Despite the general tendency to larger funds, the average target size of PE is steadily declining since early 2019, indicating that there are a lot of investment opportunities which is further backed by the growth of the industry in recent years.
Figure 18: Number of Funds Raising Capital by Strategy from 2012 to 2021, Source: Preqin Pro, February 2021
The return of the industry remains very strong, despite being a substantial time away from seeing the impact of Covid-19. Since 2019, the continuously returned more than 10% a year, while the top quartile exceeding the 20% mark reliably. Europe in particular has underperformed in recent years with a quite significant drop in 2017. North America has seen a similar development, although it is a lot less severe. Since, Asia and the rest of the world rose steeply, as visible in the Figure below.
Figure 19: Median Net IRR since Inception by Geographic Focus and Vintage Year, Source: Preqin Pro, February 2021
With regards to VC in Europe, the picture is similar to the global results. VC was very active this year in particular towards the end, despite the pandemic and the stricter handling of governments compared to the US. Both deal count and the (estimated) deal value are at a record high. In total, there were 9.3k deals worth €42.8bn in 2020. The number of deals jumped by almost 2k which is more than double any other previous growth in the number of deals. Figure 20 shows the development of deal activity in VC in Europe from 2010 to 2020. There is a trend towards higher deal values, as shown in Figure 21. More than 50% of deals are worth more €25m, while deals below €1m only account for around 10%. Moreover, there were substantially more deals worth more than €500m, e.g. Revolut and N26. It is expected that such deals will grow to values beyond €1bn relatively soon.
Figure 20: VC Deal Activity in Europe from 2010 to 2020, Source: Pitchbook, February 2021
Figure 21: VC Deals in Europe by Size from 2010 to 2020, Source: Pitchbook, February 2021
The deal activity in VC was surprisingly high, although this positive development did not transfer to fundraising in the same degree. Nonetheless, capital raised also set a new record high with €19.6bn in 2020 and the number of funds rose to 172, which is still way below the record of 2017 with 241 funds, which is shown in Figure 22. However, this development can be also be seen positively as during the last years, there were typically more fund closures than in the years before 2016. This development is in line what has been observed in the global VC market. Despite the higher number of extremely large funds, the number of small funds rose as well, which can only be achieved by a substantial growth in the industry.
Figure 22: Fundraising in VC in Europe from 2010 to 2020, Source: Pitchbook, February 2021
Private Debt
Private debt had a good year in 2020, as most indicator for the industry rose. The AuM of the industry rose from $854bn in December 2019 to $887bn in 2020 (as of June). This is likely to have increased for December 2020, as the effect of the crisis mostly hurt in the short-term but was financially beneficial in the remaining quarter, as it was the case for the other alternative assets, in particular as global interest rates are close to 0%. The AuM of the industry is likely to increase going forward not only because of the economic ecosystem but also because private debt is becoming the preferred medium in order to finance buyouts, as shown in Figure 23. In a survey from Dechert LLP and Mergermarket, it was also looked at the development over the last three years, during which around 50% held the means of financing constant but 35% increased their use of private debt to finance buyouts.
Figure 23: Survey Response on How Buyouts Are Financed, Source: Dechert LLP & Mergermarket, December 2020
From a fundraising perspective, there were some issues which caused the fundraising to fall by 10% in comparison to 2019 with $118bn raised by 200 private debt funds. However, a quarter of funds raising capital exceeded their target. The industry sees an increased consolidation, as there were several large funds that accumulated a high portion of the fundraising in the industry which causes some issues for smaller and lesser known funds. The inflow of capital in the industry is largely driven by distressed debt and special situations. Those two strategies are also mostly responsible for the good results in AuM growth and fundraising that is only slightly down from last year. As it was the case for private equity, private debt sees also more interest from Asia, not only for investment opportunities but also capital commitment. Figure 24 below shows the development in fundraising in Asia.
Figure 24: Fundraising in Asia from 2001 to 2020, Source: Preqin, February 2021
The dry powder of the industry stood at $320bn at the end of December 2020, which is an increase in 19% from the previous years. There were several reasons for the slowdown in the deployment of capital. At the beginning of the year, it was certainly Covid-19 and its impact on how business is conducted, by replacing traveling and in-person meetings with online conferences. Other reasons, most likely later during the year, include the increase number of mega deals (above $1bn), which not every fund can afford, a reduction in M&A activity and an abundant liquidity in other debt pools.
Real Estate
The real estate industry has certainly been hit the most by Covid-19 and the lockdowns imposed by governments, especially certain sectors such as hotels and alike as well as retail real estate. While hotels essentially went to zero income, if they were not creative by using the space for some other purpose, e.g. providing the location for the isolation of Covid-19 patients. Several hotels went bankrupt and many of them closed for months, the sector’s outlook is promising with the start of vaccinations in late 2020, although there is a treat of further mutations of the virus which may be unaffected by the vaccine. The retail sector will struggle going forward, as the “new normal” introduced by Covid-19, drove many people to do a lot more online including shopping. While shopping in stores will certainly bounce back, it will not reach its previous level anymore, as some of the in-person shopping will move to online shopping indefinitely. This development will certainly benefit the logistics sector which has a good chance of becoming a key driver of real estate going forward. Despite the harsh economic environment for real estate, the industry’s AuM grew to $1.09tn in 2020, being up 4.7% from December 2019. The performance achieved in 2020 (as of June) looks less promising, as the real estate funds as a whole returned -1.4%. However, this result needs to be looked at cautiously, as Q2 was most severely affected by Covid-19 and the subsequent quarters are likely to have done better. Figure 25 shows the key challenges in the coming twelve months from an investor’s and a fund manager’s perspective. Mostly, investors and fund managers agree on the issues, with the only point which there are substantial differences is the concern of rising interest rates. The key challenges are asset valuation, exit environment and competition for assets.

 
Figure 25: Key Challenges for Real Estate Returns in the Coming 12 Months, Source: Preqin Fund Manager, November 2020
Fundraising has been hit hard as well, as the capital raised dropped to $118bn in 2020, down from $179bn in 2019. The number of funds raising also collapsed from 494 in 2019 to only 283 funds in 2020. A positive development is the number vehicles outstanding, which has risen to a record high of 1,068 with a targeted capital at a record $314bn. This has likely been caused by a reversion of the trend of consolidation and by the fewer fund closings in 2020. Aside from sectors that have been hit hard by the pandemic, private equity real estate (PERE) plummeted as well. Both, the number of deals and their value, dropped by almost 50%. The number of deals dropped from 9,848 in 2019 to 5,979 in 2020. Similar as for PE and PD, real estate dry powder is at a record level of $324bn will cause a fierce competition on good deals in the market currently, especially, as it can reasonably expected that interest rates will remain low for the foreseeable future.
ESG
The interest in ESG has skyrocketed in 2020, in particular from the investor’s side but the institutions are following those demands of investors. Morningstar reported that AuM of global sustainable funds topped the $1tn mark in June 2020 and rose to $1.23tn by the end of the third quarter in 2020. Alongside, the tremendous growth in AuM, the number of funds and ETFs around ESG skyrocketed. For example, in the European market, there were 166 new offerings in the third quarter alone, whereas in 2019 there were around 200 offerings over the entire year. This development is of high importance, as 2019 already broke all previous records with such numbers by a wide margin. Based on these developments, Stone Mountain Capital became a signatory of the UN Principle of Responsible Investments (PRI) in March 2020. The number of signatories of the PRI are another good indicator for the wide adoption of ESG considerations, as in H1 2020, the PRI saw an increase of 28% of signatories and being at more than 3,000 members as of H1 2020 and collectively managing more than $100tn. Figure 26 shows the development of PRI signatories and the aggregate AuM.
Figure 26: Number of Signatories of the PRI and the total AuM, Source: UN PRI & CFA Institute, January 2021
2021 Crypto Predictions – Veradi Verdict Issue #117 by Paul Veradittakit from Pantera Capital
This issue of VeradiVerdict will be the last one of the year and what a year it has been! I thought that this would be a year full of travel but the pandemic has changed our lives, how we do business, how we do deals, and how we interact with others. While it’s been a year of change, it has also accelerated the adoption of cryptocurrencies from both institutional and retails investors. In addition to the theme of asset diversification/store of value with many more platforms to gain access, we’ve seen quite a bit of progress on scalability and applications, especially decentralized finance.
Inspired by an annual exercise that I got from Fred Wilson of Union Square Ventures, I reflected on my predictions for 2020 and create new ones for 2021. It’s always fun to see how past thoughts have fared while digging deep to figure out areas of interest for the future. I recently published my 2021 predictions on Coindesk but figured I’d resend here with some updates, especially now that the price of Bitcoin has reached another all-time high of $28,200 at the time of this writing!
Again, I am wishing everyone a safe and happy holidays and new year, and I believe that 2021 will be a monumental year for the blockchain/crypto industry, the best yet!
Figure 27: BTC Price from End of December 2019 to End of December of 2020, Source: VeradiVerdict & CoinGecko, January 2021
2020 has been an exciting year for the crypto space, including immense growth in the value of bitcoin and decentralized finance (DeFi), major moves towards central bank digital currencies (CBDCs), and better tech that makes building decentralized apps (dapps) easier than ever. Here are seven areas where I see the space going in 2021!
  • Bitcoin: Bitcoin shot up from roughly $7,000 in January to nearly $30,000 by the end of 2020 and is only seeing more interest from everyday users and institutional investors. BTC’s value will continue to skyrocket in the next year.
  • CBDCs: We saw key developments in CBDC research this year, including a significant pilot in China and in-depth research from several European banks and the Federal Reserve. I hope to see even more CBDC pilots in 2021, and possibly even full roll-outs in China or Japan.
  • DeFi: 2020 was undoubtedly the year of DeFi; in a matter of hours, dozens of protocols this year were able to capitalize by hundreds of millions of dollars. People are catching onto the immense returns from liquidity mining and DeFi, and it’s likely we’ll see several more massive projects in 2021.
  • Adoption: Crypto is becoming more financially lucrative, is being used in more and more retail applications and is catching the public eye with large scale projects like CBDCs and Facebook’s diem (formerly Libra). Given these several factors, it’s likely that 2021 will be pivotal mainstream crypto adoption.
  • Regulation: As crypto functionality expands into more retail and everyday use cases, I expect to see more regulatory guidance from key agencies about crypto as an everyday store of value. For the first time this year, the Internal Revenue Service asked taxpayers about their financial history with virtual currencies. With the launch of more CBDCs and stablecoins, governments will pay closer attention in 2021 to how cryptocurrencies are being used and how they ought to be regulated. 
  • M&A: Crypto mergers and acquisitions grew this year from an average deal size of $19.2 million in 2019 to $45.9 million in 2020, according to Pantera’s research. More and more crypto companies are reaching unicorn status, and Coinbase will have an initial public offering (IPO) next year. There will be more companies exploring SPACs as a way to go public also. As more projects pop up in the space, corporate development and M&A will become a greater trend in crypto in 2021. 
  • Digitized Private Assets: As financial institutions grow their interest in crypto, they are beginning to catch onto how blockchain technologies and cryptography can better support the existing economy. Traditional securities bookkeeping is incredibly inefficient and secure and can be significantly enhanced with cryptographic signatures and automation. I look forward to seeing how institutions will explore the potential of asset digitization in 2021.
It has been an eventful year, to say the least. In terms of blockchain and crypto, we saw several key developments: the halving of Bitcoin, liquidity mining and the explosive growth of several decentralized finance (DeFi) applications, stronger tools for blockchain interoperability and much more. 
As 2021 begins and the globe slowly eases its way out of the COVID-19 pandemic and associated market fluctuations, I look forward to seeing even more growth in the innovation, widespread use and diverse impacts of blockchain technologies. The space is becoming simultaneously more complex and more accessible, broadening the horizons for what the crypto community can achieve in building decentralized, user-first financial systems.
On last year’s predictions
Here is a review of my predictions from
 last year. Along with a summary of how that space or trend fared in 2020, I’ve included an accuracy rating to assess how well the prediction held up, with one being least accurate and five being most accurate.
Diem (formerly Libra)/Novi (formerly Calibra): Given Diem’s eventful (in the regulatory sense) public reveal in 2019, I expected 2020 to be an equally exciting year for Facebook’s project in terms of developing a reputation, fighting key regulatory battles and beginning to build up adoption. On the contrary, Diem’s launch was delayed and it stayed predominantly under the public radar throughout 2020. 
In April, the association announced that it would make key modifications to its architecture to address some of the main regulatory concerns brought against it. The governing association also renamed the project from Libra to Diem, and the wallet was renamed from Calibra to Novi. Most recently, key individuals in the initiative claimed that the platform could launch as early as January 2021. Even if Diem didn’t catch the public eye as much in 2020, they definitely made some key developments behind-the-scenes. Additionally, with the groundbreaking federal antitrust lawsuit against Facebook, Instagram and WhatsApp, the project is likely to get significantly more attention in the months ahead.
Accuracy: 3
Halving: Bitcoin’s halving from a block reward of 12.5 BTC to 6.25 BTC in May of this year certainly garnered a lot of widespread attention, but the exact effect of the halving event on the price of bitcoin is still ambiguous. There was a muted reaction to the halving event: a few days after, the price even dropped a little. Some experts proposed the halving had been
 “priced in” in the months leading up to it. In other words, because investors expected bitcoin’s price to appreciate the price naturally inflated before the halving event, making the exact change following the event less noticeable. 
Even if not immediate, the halving certainly had a major effect on the long-term outlook for bitcoin and the macro narrative that has since dominated the dialogue with traditional investors on bitcoin’s potential.
Accuracy: 4
Gaming: Unfortunately, in 2020, we didn’t see that many new developments in the blockchain space for gaming, and certainly not many public facing launches. Many game developers still face a great deal of technical friction in terms of building on chain, due to its complexity and often slow runtime. Still, the interest in the concept has not subsided. Many game creators are exploring how non-fungible tokens (NFTs) can be used as valuable digital assets in games. 
Several studios, including
 Pixelmatic, Ubisoft and Atari have all claimed that blockchain technologies could play important roles in their games in the future, and are beginning to actively explore the concept. As of today, one of the most promising and well-known blockchain games is “The Sandbox,” a game kind of like Minecraft where users can monetize digital assets via the blockchain. The Sandbox has already announced partnerships with major game developers like Atari and Square Enix.
Accuracy: 2
DeFi growth: If nothing else, 2020 was the year of DeFi. One of the biggest trends of the year, undoubtedly, was liquidity mining. To keep it simple, liquidity mining is essentially where users supply their own assets as liquidity to a protocol in exchange for a protocol’s governance token. Over time, due to lots of interest, this governance token increases in value, often generating immense returns for the liquidity-supplying user and incentivizing them to keep supporting the DeFi protocol. This year governance tokens for Compound, Balancer, Yearn.Finance and many more launched and exploded in value. Further, the value generated for these platforms’ liquidity suppliers was around 100-200% APR. 
In January, a grand total of $1 billion was locked into DeFi platforms collectively. In August, it peaked at
 $15 billion USD. Interestingly, MakerDAO continues to be the platform with the most value locked in, though that first-place position was usurped several times over the year by Compound and other platforms. Users are beginning to reap the benefits of a decentralized, community-owned financial system. We’ll likely see this excitement and rapid growth continue through 2021.
Accuracy: 5
Central bank currencies: The COVID-19 pandemic had, and is continuing to have, a massive economic impact on several of the world’s largest economies. It’s also raised some serious doubt about the government’s competence and intentions in its economic policy and highlighted some key concerns and difficulties with the efficiency of our existing economic system. While we may have not seen any significant launches in central bank currencies in 2020, the space definitely saw a lot more interest as more governments, banks and research institutions explore how crypto can enhance our financial system. 
China’s central bank is working on a digital currency pilot, which has seen over
 4 million transactions and 2 billion yuan in gross volume. In October, several financial institutions including the Bank of Canada, the Bank of England, the European Central Bank and the U.S. Federal Reserve collectively published a report outlining the key features necessary in a successful, feasible CBDC. The Federal Reserve also has been actively working towards the development of a digital dollar.
Accuracy: 4
Infrastructure & Web 3.0:2020 saw the launches and announcements of several key infrastructural projects within the blockchain space that will enable a great diversity of decentralized applications in the future. One of the year’s largest was the public launch of the
 Alchemy API, which positions itself as the AWS of blockchain. It’s building infrastructure that makes it simple to manage and build on top of Ethereum nodes and currently powering $7.5 billion in on-chain transactions annually. 
Other Web 3.0 infrastructure tools include the
 Keep protocol, which provides developers with off-chain storage for dapps; API3, which works with the API ecosystem to build blockchain-native oracles and bring the massive returns of DeFi and dapps to API providers; and the Oasis Protocol, which builds blockchain-enabled tools to help developers securely analyze data and guarantee user privacy. Given the generally growing interest in decentralized applications overall, I hope to see more developers take advantage of these technologies to reduce the complexity of building dapps and expanding their use cases. 
Accuracy: 4
Regulatory hurdles: In general, throughout 2020, we saw less public attention and debate on regulating crypto, likely because government financial institutions were likely focused on other areas (rightly so), due to the implications of the pandemic. However, several government agencies made key regulatory actions throughout 2020 that demonstrate how they are thinking more seriously about cryptocurrency and the role it plays in the modern American economy.

In 2020, the SEC charged crypto firms roughly $40 million in penalties, while the CFTC charged crypto firms roughly $9 million in penalties, an all-time high for the latter. Most of these sanctions and penalties are targeted around initial coin offerings (ICOs) and gray areas around whether certain tokens should be deemed securities or commodities. Some of the most prominent developments from this year include the SEC’s proposed safe harbor for crypto entrepreneurs, the CFTC’s case against Abra, for selling security-based swaps to investors without listing them on a recognized national exchange, and the CFTC’s case against BitMex, for offering illicit crypto services to their users. 
Accuracy: 3
Looking Ahead
Here are seven areas where I expect to see lots of promising innovation and growth throughout 2021.
Bitcoin will continue to grow immensely in value and popularity, as the original flagship cryptocurrency. Bitcoin started
 the year hovering at a price of $7,000 and climbed to fresh all-time highs above $28,000. Payment giants like PayPal and Square are making it easy for everyday users to purchase bitcoin, and institutional investors are showing more interest than ever. Following a 90% growth in price in 2019, and a whopping 170% growth in price in 2020, I look forward to seeing bitcoin grow in value even more and become more widely-used. 
Governments will be exploring central bank digital currencies (CBDCs) more seriously, and we may see a launch in 2021. As mentioned above, several governments and cross-governmental agencies demonstrated a serious commitment to exploring how CBDCs can better support economies, via pilots and in-depth case studies. With the impending
 Diem launch and other projects like Celo rolling out more products and functionalities, it’s likely that stablecoins will generally gain more traction as a viable vehicle for money transfer, spurring even more governmental interest. 
China’s pilot with the digital renminbi (DC/EP) has gone exceedingly well, and availability is targeted to expand next year, maybe even faster than we expect. In Japan, 30 banks are already investigating a digital currency offering, and the country may even see a full public roll out in 2021 itself. The
 Bank of England also continues to investigate applications for CBDC in retail, and could begin pilots next year as well. 
DeFi will continue to explode in value. In 2020, we saw a ridiculous 15-fold increase in the value locked in DeFi protocols. Much of this growth was driven by the trend of liquidity mining, kickstarted by some key players like Compound and Balancer, where protocols incentivized users to supply liquidity in exchange for governance tokens that appreciated quickly over time. 
The community also saw a trend of developers forking existing protocols and platforms to build ones for more custom use cases or enhanced decentralization and privacy. Some key ones include Cream Finance, which is a fork of Compound and Swerve Finance, which is a fork of Curve. It’s more lucrative (and easier) than ever to set up a DeFi protocol, and I look forward to seeing more projects in this space and another whopping increase in the total value locked across all platforms. The incredible capitalization of these existing platforms could also set them up to support more unique functionalities, including larger loans, differentiated lending products and more. 
Crypto will begin to see widespread mainstream adoption. Even the harshest critics of cryptocurrency and digital currency are beginning to see the immense value that can be generated by these technologies. The explosive growth on DeFi protocols itself is too strong of an argument to reject. In
 Latin America and Southeast Asia, more and more people are using cryptocurrency to settle regular, everyday financial transactions. Additionally, as the community comes up with better primitives, tools and abstractions for building dapps, developers will be able to position these tools in more appealing ways to everyday consumers. Given the convergence of all these factors, 2021 could be the pivotal year for driving mainstream crypto adoption. 
With widespread mainstream adoption, we’ll begin to see some more regulatory clarity, especially in retail use cases. As crypto becomes more mainstream, it becomes a more important issue for regulatory agencies to focus on. The vast majority of crypto regulation thus far has been centered around distinguishing securities from commodities and ensuring that tokens follow appropriate guidelines per SEC and CFTC rules. Not as much work has been done on crypto as an everyday store of value, and how stablecoins and other digital currencies can be used for retail, compensation and more. 
Governments are interested in how crypto transactions would affect
 taxes, especially demonstrated by the IRS’s inquiry into digital financial activities. Above all else, the growing interest in using cryptocurrency, not exclusively as a means for trading, lending or investing, but as a literal replacement to cash and credit in our everyday financial activities will necessitate much more regulatory work from key agencies in 2021. 
2021 will see several crypto acquisitions, unicorns, an IPO, and more SPACs. Coinbase looks set to go public in 2021. Along with Coinbase, several other prominent crypto companies have reached
 Unicorn status, including Circle, Binance and Ripple. Companies that reached at least a few hundred million in value will explore going public through SPACs. Additionally, crypto M&A continues to grow, with the average deal value of 2020 being $45.9 million, more than double of 2019’s average value of $19.2 million. 
As more people become interested in the space and more crypto projects spin up, it’s only natural that we’ll see a sharp hike in the amount of crypto business development, via more acquisitions, and more projects reaching unicorn status. Especially given the massive inflow of institutional capital as the world’s leading financial institutions become more curious about crypto, M&A and business development will play an even larger role in the 2021 crypto entrepreneurship scene.
Private assets will slowly start to go digital. Beyond the pure financial value that can be generated by decentralization and cryptocurrency, large financial institutions are also beginning to see significant potential in the underlying blockchain technologies and some key ways they could support existing financial systems. Traditional securities bookkeeping has a poor record of ownership, significant manual oversight for compliance and long/slow trading workflows.
 Digitizing bookkeeping using blockchain and cryptography could make things significantly cheaper and more secure.
Using cryptographically verifiable keys can provide a more trusted record of ownership, and digitization also naturally leads to faster workflows and more automations. Such a change is likely to be slow, because it challenges a longstanding paradigm within the financial industry, but it definitely generates a significant amount of value for the space and banks are beginning to keep their eye on it. 
Final Thoughts
2020 may have been the blackest of black swans, and still, the crypto space saw some incredible developments, innovations and growth. As 2021 begins and the world begins its return to “normal,” the incumbent changes over the next few months will certainly have an effect on crypto interest and usage, both from blockchain developers and everyday users. Despite the inevitable challenges, however, I’m extremely excited for the space in 2021. 
We’re reaching some significant inflection points in areas from retail adoption, to nationalized digital currencies, to faster blockchain technologies and these developments will hopefully power a brighter, more accessible and even more decentralized financial future in the years to come. 
Paul Veradittakit | Partner Venture Capital Pantera Capital

E : [email protected]
M : +1 415 494 9001

Paul is a partner at Pantera Capital, where he works since almost seven years. He is an allrounder with several different activities and is highly interested in the blockchain technology. Furthermore, he is a board member at Blockfolio and at Staked. He also works as advisor for several companies, such as Ampleforth, Audius and Al Foundation.
Pantera Capital was the first investment firm focused exclusively on bitcoin, other digital currencies, and companies in the blockchain tech ecosystem.  Pantera manages over $1.8 billion across three strategies – passive, hedge, and venture. Prior to founding Pantera in 2003, Dan Morehead served as Head of Macro Trading and CFO at Tiger Management.
STONE MOUNTAIN CAPITAL
Stone Mountain Capital is an advisory boutique established in 2012 and headquartered in London with offices Pfaeffikon in Switzerland, Dubai and Umm Al Quwain in United Arab Emirates. We are advising 30+ best in class single hedge fund and multi-strategy managers across equity, credit, and tactical trading (global macro, CTAs and volatility). In private assets, we advise 10+ sponsors and general partners across private equity, venture capital, private credit, real estate, capital relief trades (CRT) by structuring funding vehicles, rating advisory and private placements. As of 7th July 2020, Stone Mountain Capital has total alternative Assets under Advisory (AuA) of US$ 56.1 billion. US$ 44.6 billion is mandated in hedge funds and US$ 11.5 billion in private assets and corporate finance (private equity, venture capital, private debt, real estate, fintech). Stone Mountain Capital has arranged new capital commitments of US$ 1.61 billion across hedge fund, private asset and corporate finance mandates and has been awarded over 45 industry awards for research, structuring and placement of alternative investments. As a socially responsible group, Stone Mountain Capital is a signatory to the UN Principles for Responsible Investing (PRI). Stone Mountain Capital applies Socially Responsible Investment (SRI) filters to all off its alternative investment strategies and general partners on behalf of investors. 
 
Our Team   Our Mandates   Our Research   Our News


Contact

We are able to source any specific alternative investment search and maintain relationships with dozens of best-in-class hedge fund managers, private equity and private debt general partners (GPs) and real estate and infrastructure developers. We don’t pass any costs on to our investors, since our compensation comes from our mandated managers, GPs and developers. Please contact us, should you require further information about our solutions.  

Twitter
LinkedIn
Facebook
Google Plus
Website
Email
Schedule a call with the team
Main UK Tel.: +44 207 268 4905
Main Switzerland Tel.: +41 44 586 45 55
Main UAE Tel.: +971 4383 5386
We have updated our privacy policy to take into account the new requirements of the GDPR. Please take some time to read the policy, which explains what personal data we collect, why we collect it, how we use it and other relevant information. You can review our privacy policy here, our anti-bribery policy here and our commitment to the UK stewardship code here. Stone Mountain Capital LTD is registered (Reference: ZA589246) in the data protection public register of the Information Commissioner's Office ('ICO') in the United Kingdom.

No action is required if you wish to remain in contact, however please reply if you want your details removed by contacting us at [email protected] or by using the unsubscribe button below. In case this newsletter has been forwarded to you and you want to subscribe, please click here.

Stone Mountain Capital is a limited company (LTD) registered in England & Wales with registered number 8763463. The registered address is: One Mayfair Place, Devonshire House, Mayfair, London W1J 8AJ, England, United Kingdom. Stone Mountain Capital LTD is authorised and regulated with FRN: 929802 by the the Financial Conduct Authority (‘FCA’) in the United Kingdom. Stone Mountain Capital LTD is the Distributor of foreign collective investment schemes distributed to qualified investors in Switzerland. Certain of those foreign collective investment schemes are represented by First Independent Fund Services LTD, which is authorised and regulated by the Swiss Financial Market Supervisory Authority (‘FINMA') as Swiss Representative of foreign collective investment schemes pursuant to Art 13 para 2 let. h in the Federal Act on Collective Investment Schemes (CISA). Stone Mountain Capital LTD conducts securities related activities in the U.S. pursuant to a Securities and Exchange Commission ('SEC') Rule 15a-6 Agreement with Crito Capital LLC, a U.S. SEC registered broker-dealer, and member of Financial Industry Regulatory Authority (‘FINRA’), Securities Investor Protection Corporation (‘SIPC’) and Municipal Securities Rulemaking Board (‘MSRB'). Stone Mountain Capital Partners LLP is incorporated as limited liability partnership in England & Wales with company registration number: OC430515. Its registered office is: One Mayfair Place, Devonshire House, Mayfair, London W1J 8AJ, United Kingdom.  Stone Mountain Capital Partners LLP is registered as Appointed Representative with FRN: 934964 of Stone Mountain Capital LTD which is authorised and regulated with FRN: 929802 by the Financial Conduct Authority (‘FCA’) in the United Kingdom. Stone Mountain Capital FZC is registered at: Business Center, Al Shmookh Building, Umm Al Quwain Free Zone, Umm Al Quwain, United Arab Emirates. All information in this perspective including research is classified as minor acceptable non-monetary benefits ('MNMB') in accordance with article 11(5)(a) of the MiFID Delegated Directive (EU) 2017/593 and FCA COBS 2.3A.19.

Copyright © 2021 Stone Mountain Capital LTD. All rights reserved.
Any business communication, sent by or on behalf of Stone Mountain Capital LTD or one of its affiliated firms or other entities (together "Stone Mountain"), is confidential and may be privileged or otherwise protected. This e-mail message is for information purposes only, it is not a recommendation, advice, offer or solicitation to buy or sell a product or service nor an official confirmation of any transaction. It is directed at persons who are professionals and is not intended for retail customer use. This e-mail message and any attachments are for the sole use of the intended recipient(s). Our LTD accepts no liability for the content of this email, or for the consequences of any actions taken on the basis of the information provided, unless that information is subsequently confirmed in writing. Any views or opinions presented in this email are solely those of the author and do not necessarily represent those of the limited company. Any unauthorised review, use, disclosure or distribution is prohibited. If you are not the intended recipient, please notify the sender by reply e-mail and destroy all copies of the original message and any attachments. By replying to this e-mail, you consent to Stone Mountain monitoring the content of any e-mails you send to or receive from Stone Mountain. Stone Mountain is not liable for any opinions expressed by the sender where this is a non-business e-mail. Emails are not secure and cannot be guaranteed to be error free. Anyone who communicates with us by email is taken to accept these risks. This message is subject to our terms at our Disclaimer.
 

Comments are closed.
    ExchangeRates.org.uk


    ​Archives

    March 2025
    February 2025
    January 2025
    December 2024
    November 2024
    October 2024
    September 2024
    August 2024
    July 2024
    June 2024
    May 2024
    April 2024
    March 2024
    February 2024
    January 2024
    December 2023
    November 2023
    October 2023
    September 2023
    August 2023
    July 2023
    June 2023
    May 2023
    April 2023
    March 2023
    February 2023
    January 2023
    December 2022
    November 2022
    October 2022
    September 2022
    August 2022
    July 2022
    June 2022
    May 2022
    April 2022
    March 2022
    February 2022
    January 2022
    December 2021
    November 2021
    October 2021
    September 2021
    August 2021
    July 2021
    June 2021
    May 2021
    April 2021
    March 2021
    February 2021
    January 2021
    December 2020
    November 2020
    October 2020
    September 2020
    August 2020
    July 2020
    June 2020
    May 2020
    April 2020
    March 2020
    February 2020
    January 2020
    October 2019
    September 2019
    August 2019
    July 2019
    June 2019
    April 2019
    January 2019
    November 2018
    August 2018
    May 2018
    January 2018
    December 2017
    November 2017
    October 2017
    June 2017
    March 2017
    February 2017
    January 2017
    November 2016
    October 2016
    August 2016
    July 2016
    June 2016
    May 2016
    April 2016
    March 2016
    February 2016
    January 2016
    December 2015
    November 2015

    Categories

    All
    Bitcoin
    Blockchain
    China
    Corporate
    Credit
    Cryptocurrency
    CTA
    Direct Lending
    Emerging Markets
    Equity
    ETF
    Ethereum
    Fund Of Hedge Fund
    Global Macro
    Hedge Fund
    Index
    Middle Market
    Private Debt
    Private Equity
    Rating
    Real Estate
    Risk Premia
    SME
    State Owned Enterprise
    Stocks
    UCITS
    Venture Capital
    VIX
    Volatility
    VSTOXX

    RSS Feed

PRIVACY POLICY
ANTI-BRIBERY POLICY
UK STEWARDSHIP CODE
CONTACT
ESG POLICY
DISCLAIMER
Picture

​Stone Mountain Capital LTD is authorised and regulated with FRN: 929802 by the Financial Conduct Authority (‘FCA’) in the United Kingdom. 
The website content is neither an offer to sell nor a solicitation of an offer to buy an interest in any investment or advisory service by​
Stone Mountain Capital LTD and should be read with the DISCLAIMER.
© 2025 Stone Mountain Capital LTD. All rights reserved.
  • About
    • United Arab Emirates
    • Estonia
    • Partners
    • Ventures
  • Team
    • Oliver Fochler
    • Ashvin Chotai
    • Pascal Hasler
    • Alexander Rothlin
    • Claudio Calonder
    • Joaquin Abos
    • Alliances
  • Advisory
    • Corporate Finance
    • Solutions
    • Mandates
  • Research
    • Perspective Subscription
    • News
    • Awards
  • Contact
    • Privacy Policy
    • Anti-Bribery Policy
    • UK Stewardship Code
    • ESG Policy
    • Disclaimer
  • Login