Hedge Funds
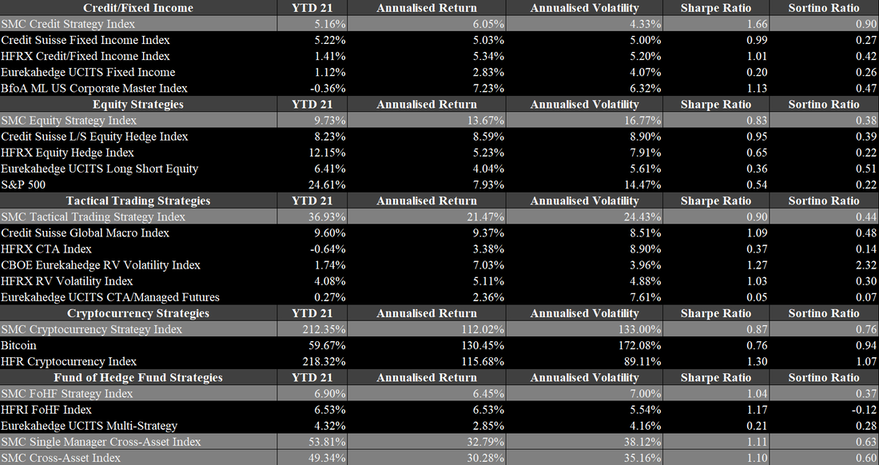
Hedge funds had a great 2021 and managed to set a record high in its AuM. As of the third quarter in 2021, the AuM of the industry is expected to be between $4.3tn and $4.6tn depending on the sources. According to BarclayHedge, the industry’s AuM just surpassed the $4.5tn mark at the end of the third quarter. This is a steep increase from just $3.8tn in 2020, as shown in Figure 6. This is a gain of more than 18% in less than a year. It is expected that the number will rise slightly, once the Q4 2021 numbers are out, as October and November 2021 were rather positive. Nonetheless, December 2021 will have dampened the results of Q4 2021. Generally, the industry has gained substantially over the past ten years, despite a rather inferior view from market participants during most of that period. The AuM soared thanks to two reasons. Firstly, the industry saw substantial capital net inflows. During the first three quarters, the industry received $41bn in fresh capital after having received another $19bn in the second half of 2020. Since then, the industry saw net inflows in every quarter, which is stark break from previous years when the industry experienced net outflows in most quarters. In Q4 2021, net inflows rose to $81bn in 2021, according to Eurekahedge. Figure 7 also shows the severe initial impact of Covid-19 in 2020, when accounting for the significantly positive inflows in the latter half of the year. The second reason for the steep increase in AuM is due to the performance of the hedge fund industry in 2021. Hedge funds in 2021 returned slightly more than 10%, making it the third best year in history after 2020 and 2009 according to HFR. This is remarkable, as the year has not been easy with the constant uncertainty and high volatility in the market. In particular event-driven, equity and commodity strategies have performed very well and the high beta strategies within their respective sector. Figure 8 summarizes the performances of several strategies during 2021 by Eurekahedge. Distressed debt and event-driven strategies performed best with barely any negative performances during the year. Macro and fixed income strategies struggled the most throughout the year, due to the harsh economic conditions. When looking at the highlighted percentiles, it is evident that the high volatility in the market also caused high volatility in hedge fund returns, independent of the strategy. This is most relevant for long short equity strategies whose returns vary between +30% (upper percentile) and -10% (lower percentile) in 2021. Figures 9 to 13 highlight the SMC Strategy Indices in 2021 compared to their benchmarks. The SMC Credit Strategy Index gained slightly more than 5% in 2021, although the variation across strategies is substantial. Two strategies, Trade Finance Crypto and European High Yield L/S Credit did very well in the economic environment, as they reached returns above 12% and 19% in 2021. The Trade Finance Strategy is in particular remarkable, as the strategy has not experienced a negative month since its inception in 2017. The SMC Equity Strategy Index gained closely less than 10%, which is around as much as the average equity strategy in 2021. Within the sector, there was also considerable volatility, due to the sub-strategies. Unsurprisingly, the Equities US Activist Event-Driven performed best with a return exceeding 33%. More tech-focused strategies faced more issues but returned closely below 10% after an extremely successful 2020. Global macro strategies had a tough year and closed only slightly positive for the year. The SMC Global Macro Strategy Index is up almost 37% in 2021, which is largely due to the Discretionary Global Macro Strategy achieving a return of almost 70%. To nobody’s surprise, cryptocurrency strategies performed best in 2021. The SMC Cryptocurrency Strategy Index gained more than 212% in 2021. In the space, it was most important to hold a diversified account of cryptocurrencies to achieve such a great return, as Bitcoin (BTC) gained only 60%. The most successful strategies in the space focused on riskier tokens. The Token and Token Liquid strategies gained 295% and 385% respectively. Despite the great results of 2021, the gains are still inferior to the 342% in 2020. The developments in the crypto space will be discussed in a further paragraph. Lastly, another indicator that the industry is in a healthy state is the fact that the number of launches substantially exceed the liquidations and the number of active funds has reached an all-time high of 22,081.
Comments are closed.
|
|


 RSS Feed

|
|
|
Stone Mountain Capital LTD is authorised and regulated with FRN: 929802 by the Financial Conduct Authority (‘FCA’) in the United Kingdom. The website content is neither an offer to sell nor a solicitation of an offer to buy an interest in any investment or advisory service by Stone Mountain Capital LTD and should be read with the DISCLAIMER. © 2024 Stone Mountain Capital LTD. All rights reserved. |