
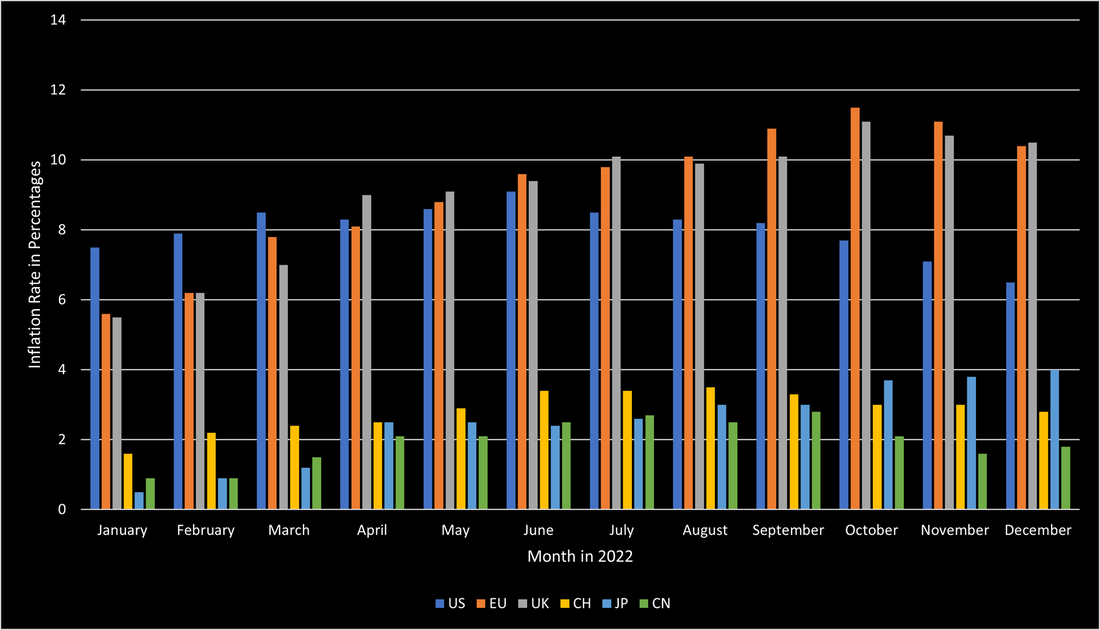
2022 was a year that tested the worldwide economy. The highest inflation in 40 years, unprecedented interest rate hikes, and the invasion of Russia into Ukraine were only some contributors to the hugely difficult year of 2022. In the US, inflation started soaring during 2021 and peaked in the summer of 2022 at 9.1%. Thanks to the central bank’s quick response, inflation has since continuously slowed down and is currently at 6.5%. Europe had significantly more issues handling the inflation crisis. The EU started the year at an inflation rate of slightly above 5.5% and it continued to soar until October 2022 when it reached its peak at 11.5%. The UK was similarly affected, despite the BoE being the fastest-acting central bank to raise interest rates. However, its inflation behaved like the EU’s and soared to its peak at 11.1% in October 2022. Both economies have not been able to reduce inflation below 10% so far. In contrast to the US, European countries were much more affected by the direct impact of the war between Russia and Ukraine. Soaring energy and food prices, for both of which Russia and Ukraine are crucial suppliers, were the main constituents causing the high inflation. Additionally, the ECB did not enjoy as much freedom as the Fed had when raising interest rates. This is in large part due to the high indebtedness of certain European countries that would have gone bankrupt if interest rates would have been raised as much as the US did. Other countries, such as Switzerland, Japan, and China stand out in this discussion, as those countries managed to keep their inflation relatively low. Switzerland managed to avoid such high inflation due to its strong currency, and a limited dependency on fossil fuels. Japan avoided high inflation through the continued quantitative easing by the BoJ. However, in contrast to the other countries, Japan’s inflation is still soaring and poses substantial issues to the country. China avoided high inflation through its rigorous Covid policies and its limited governmental support when Covid emerged. The source of this soaring inflation is a combination of the war but is largely based on unprecedented central bank intervention to save the economy during the early Covid days when large parts of the economy were completely unable to function. Figure 1 shows the inflation levels of the previously mentioned countries during 2022.
Comments are closed.
|
|


 RSS Feed

|
|
|
Stone Mountain Capital LTD is authorised and regulated with FRN: 929802 by the Financial Conduct Authority (‘FCA’) in the United Kingdom. The website content is neither an offer to sell nor a solicitation of an offer to buy an interest in any investment or advisory service by Stone Mountain Capital LTD and should be read with the DISCLAIMER. © 2024 Stone Mountain Capital LTD. All rights reserved. |