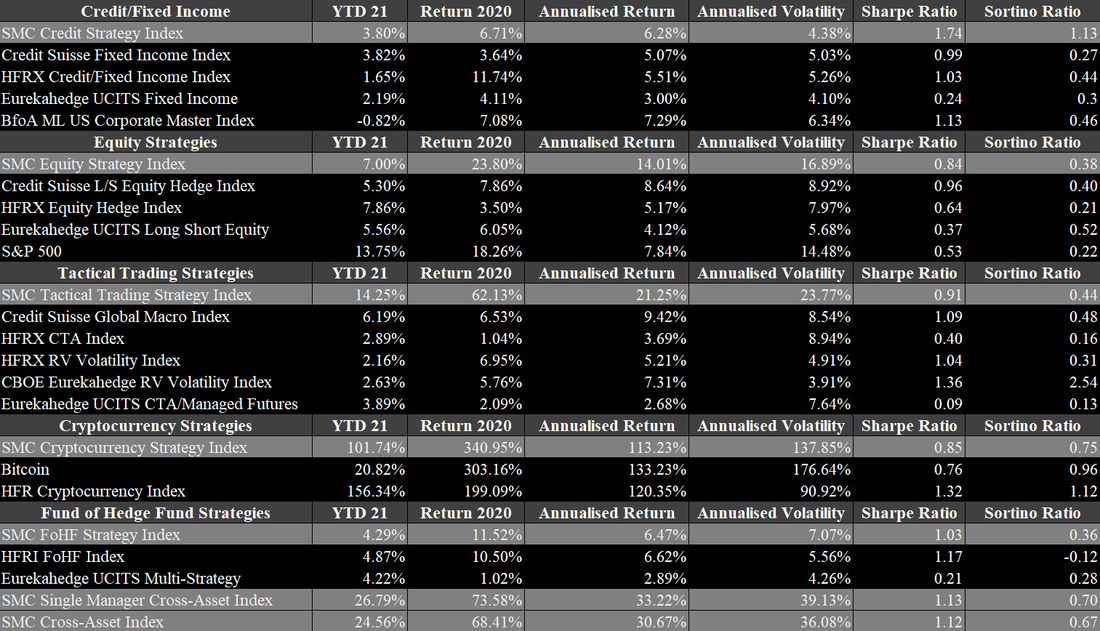
Hedge funds are doing very well currently. After having suffered substantial drawdowns in March 2020, they delivered what they promised to do. They were able to limit losses well, while profiting significantly from the subsequent upswing. This positioned hedge funds in a good light towards potential investors that previously stepped away from hedge funds or planned to, due to their frequent inability to generate excess returns in boom phases over the last few years. As the crisis was handled well by the industry, this perception significantly shifted. Preqin reported that the average return of hedge funds in 2020 was 16.69% and 12.73% as of June 2021, which are remarkable numbers for this environment. In particular, as some sectors and industries, such as fixed income, are struggling since Covid-19 emerged. Figures 9 to 14 provide a summary of our benchmark indices compared to other widely known benchmarks, based on fixed income, equity, tactical trading and fund of hedge funds strategies. Our two major benchmark indices, the SMC Single Manager Cross-Asset Index and the SMC Cross-Asset Index, are up 26.79% and 24.59% as of June 2021. Fixed Income strategies continue to struggle but managed to achieve solid one-digit returns over 2020 and 2021. The two most outstanding strategies in this asset class are European High Yield L/S Credit with a return of 13.37% in 2021 and Trade Finance Crypto with a YTD of 9.11%. The latter also has not experienced a single negative monthly return since its inception in January 2017. The performance of equity-based strategies in 2021 is 7%, while the individual strategies widely varied since 2020. On the one hand, Long/Short US Equity Consumer, TMT, Healthcare had a stellar return of 66% in 2020 but is stagnating in 2021 with a YTD of 0.13%. On the other hand, Equities US Activist Event Driven was up only 2.52% in 2020 but is up 30.68% in 2021 so far. Our SMC Tactical Trading Strategy Index is up 14% in 2021 and was up 62% in 2020. The global macro strategies deviate strongly from each other’s monthly returns. The Discretionary Global Macro strategy is up 26% in 2021, even though it suffered a loss of 18% in June 2021. In 2020, the strategy also achieved a return of 27%. The Systematic Global Macro strategy is up only 2% as of June 2021 but was up 97% in 2020. Unsurprisingly, the SMC Cryptocurrency Strategy Index had the best performance in both 2021 and 2020. In 2021, the index is up 101% and in 2020 340%. The crypto-based strategies range from Token Liquid with a YTD 2021 of 171% to Bitcoin that is up only 19.2% YTD 2021. Over the last two years, the Token strategy was the most successful one with being up 504% in 2020 and another 164% in 2021. Cryptocurrencies are further described in following section.
Comments are closed.
|
|


 RSS Feed

|
|
|
Stone Mountain Capital LTD is authorised and regulated with FRN: 929802 by the Financial Conduct Authority (‘FCA’) in the United Kingdom. The website content is neither an offer to sell nor a solicitation of an offer to buy an interest in any investment or advisory service by Stone Mountain Capital LTD and should be read with the DISCLAIMER. © 2024 Stone Mountain Capital LTD. All rights reserved. |