Alternative Markets Summary H1 2022
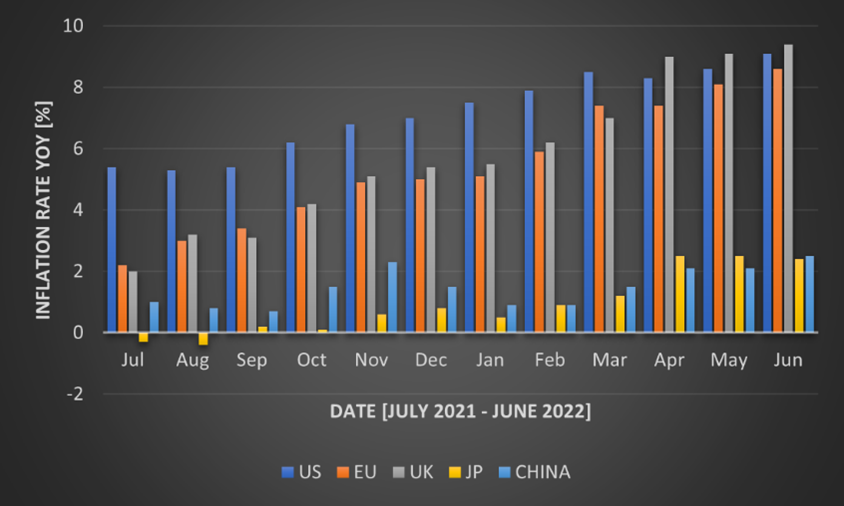
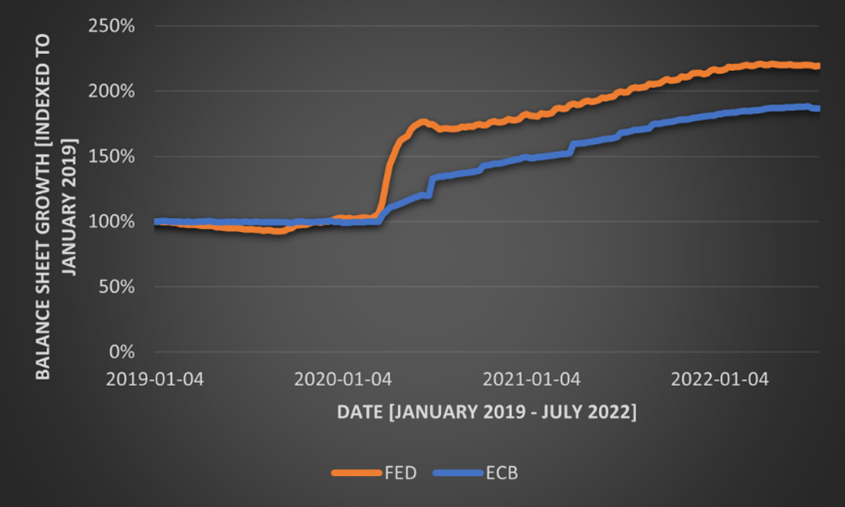
Ever since Covid-19 has subsided from the daily news, inflation has taken over. Inflation is still a major concern in the current economy. This is further exacerbated by central bank interventions that have not been fruitful yet. An additional major contributor is the ongoing war between Russia and Ukraine. As of June 2022, inflation in the US is at 9.1%, the highest it has been in the past 40 years. In the Eurozone, inflation is slightly lower at 8.6%. The UK’s inflation is even higher at 9.4%. Asian countries, such as Japan and China, managed to keep their inflation relatively low at 2.4% and 2.5%. The development of inflation over the past year is summarized in Figure 1. For Western countries, inflation has more or less continuously risen. The US started the year with inflation close to over 5%, while European countries were close to 2%. Nonetheless, Europe has caught up to the US since April, when the UK’s inflation even got higher than the US’s. A potential reason for the higher inflation in the US at the beginning of the year and back until the latter half of 2021 is the rapid and steep unconventional measures taken by the Fed. This faster intervention led to more money being in the economy earlier, which theoretically should lead to higher inflation earlier. Figure 2 shows the growth in the balance sheet indexed to January 2019. Once Covid-19 hit the economy, the US reacted a lot faster and in higher magnitudes than Europe did. Within the first months, the Fed’s balance sheet grew by almost 70%, while the ECB’s only grew by 25% in the same time frame. Since then, the two central banks acted equivalently in terms of balance sheet growth. Very recently, the central banks started to shrink their balance sheets. These measures were announced during Q2 2022 and are slowly implemented. Going forward, this balance sheet shrinking will be strengthened, which is confirmed by an announcement from the ECB recently. Nonetheless, as the graph shows, these measures barely affect the original measures taken to combat the economic consequences of Covid-19. The low inflation in China largely stems from the consequences of their zero-Covid policy. In recent months, many places have been shut down to control the spread of Covid. This led to low production levels and low demand which is reflected in the low inflation levels of the country. In the case of Japan, inflation of above 2% is significant, as the average inflation during the past three decades was only 0.3%. Its inflation largely stems from the consequences of the war and the impact it has on food and energy.
Comments are closed.
|
|


 RSS Feed

|
|
|
Stone Mountain Capital LTD is authorised and regulated with FRN: 929802 by the Financial Conduct Authority (‘FCA’) in the United Kingdom. The website content is neither an offer to sell nor a solicitation of an offer to buy an interest in any investment or advisory service by Stone Mountain Capital LTD and should be read with the DISCLAIMER. © 2024 Stone Mountain Capital LTD. All rights reserved. |