
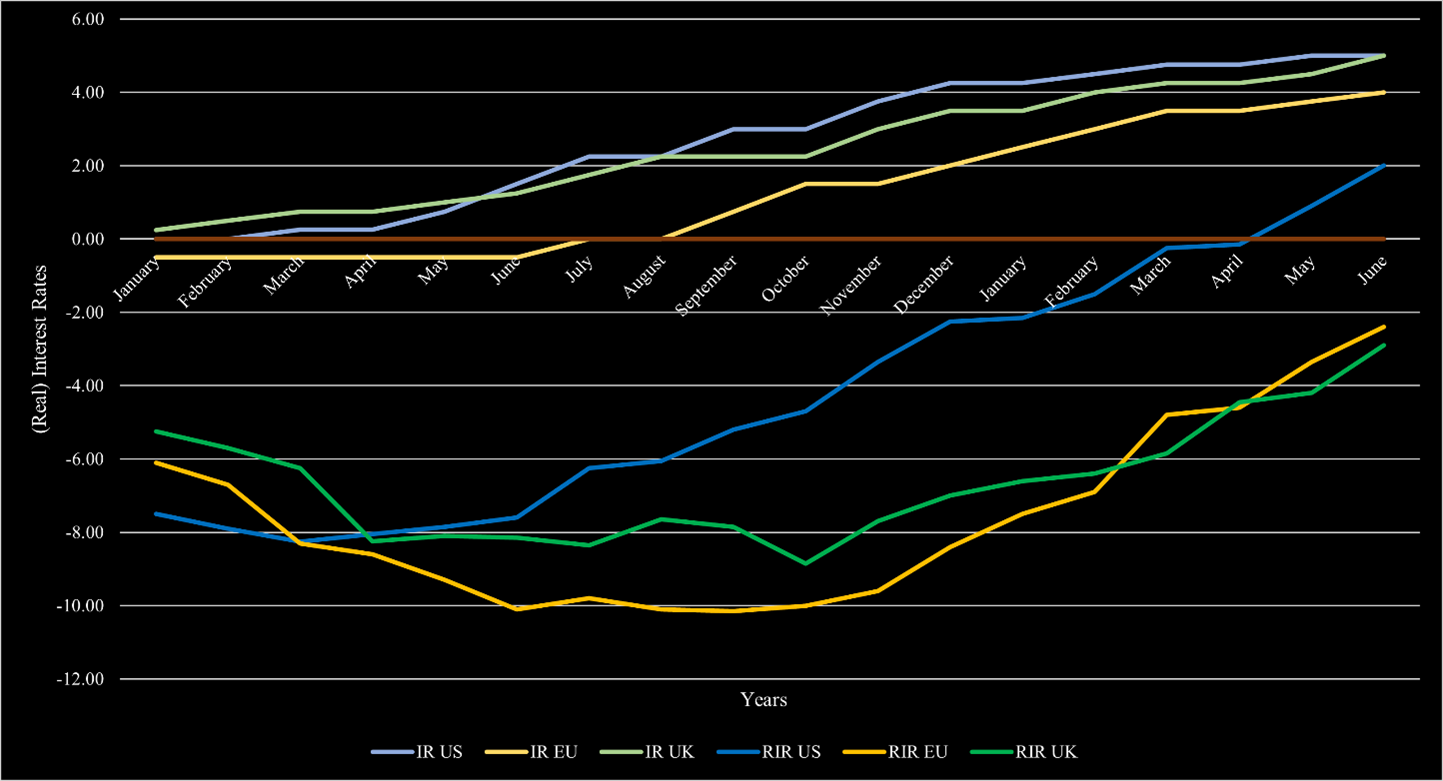
The current macroeconomic volatility has not changed. Interest rates and inflation remain elevated. At least in most markets, the inflation rate is continuously declining. In the US, inflation reached 3% and is on its way to the upper target of 2% in the short-term. Europe is following this development but still has a substantial way ahead before inflation will eventually reach those levels, as inflation remains at 6.4%. In the UK, the situation is more dire and inflation declined to 7.9% after being above 10% since August 2022. In order to bring inflation levels down, central banks have hiked substantially over the past 1.5 years. In the US, the federal fund rate is now above 5.25% with the most recent hike, which has largely been deemed unnecessary by market participants. The ECB also increased its interest rate by 25bps and is now at 4.25%. The BoE also raised its core interest rate by 25bps in their latest meeting and is now equivalent to the US’s 5.25%. The US also reached the status of positive real interest rates since the hikes started. Europe and the UK are following this trend but have not reached this territory yet. Figure 1 also shows how Europe and the UK are lacking behind the US. In the current environment, a recession is still likely. While projections have changed throughout the year, the consensus opinion remains that there will likely be a short and with a shallow to medium impact on the economy. The most notable change is that the recession expectation has pushed further and further into the future. It started with estimations that it will happen by mid-2023, then towards the end of 2023. Now, most estimates place the recession somewhen in 2024.
Comments are closed.
|
|


 RSS Feed

|
|
|
Stone Mountain Capital LTD is authorised and regulated with FRN: 929802 by the Financial Conduct Authority (‘FCA’) in the United Kingdom. The website content is neither an offer to sell nor a solicitation of an offer to buy an interest in any investment or advisory service by Stone Mountain Capital LTD and should be read with the DISCLAIMER. © 2024 Stone Mountain Capital LTD. All rights reserved. |