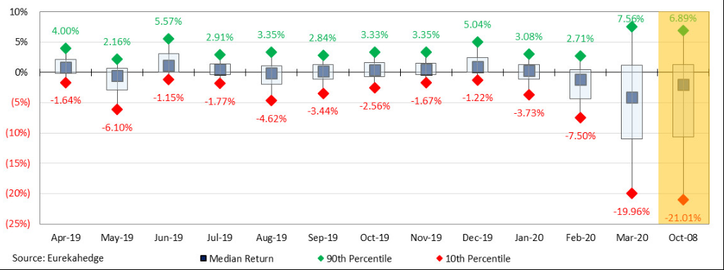
Figure 2: Monthly Returns of the Last 12 Months and the Worst Month of the Financial Crisis in 2008, Source: Eurekahedge, April 2020
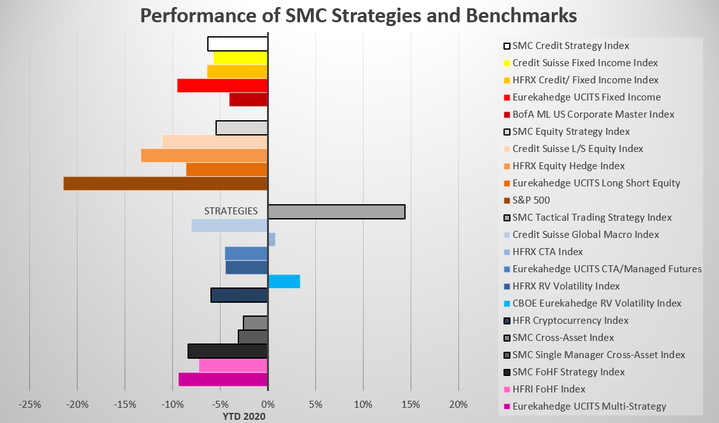
Figure 3: Performance of Stone Mountain Capital Indices Compared to its Benchmarks in Q1 2020, Source: Stone Mountain Capital Research, April 2020
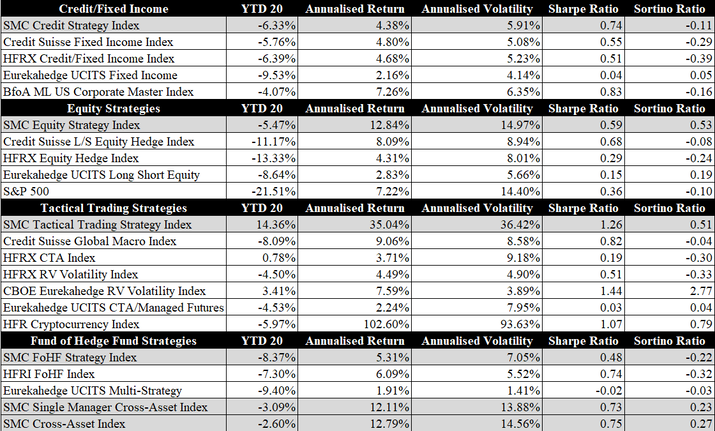
Table 1: Performance of Stone Mountain Capital Indices Compared to its Benchmarks in Q1 2020, Source: Stone Mountain Capital Research, April 2020
*|MC_PREVIEW_TEXT|*
Comments are closed.
|
|
|
Stone Mountain Capital LTD is authorised and regulated with FRN: 929802 by the Financial Conduct Authority (‘FCA’) in the United Kingdom. The website content is neither an offer to sell nor a solicitation of an offer to buy an interest in any investment or advisory service by Stone Mountain Capital LTD and should be read with the DISCLAIMER. © 2024 Stone Mountain Capital LTD. All rights reserved. |


 RSS Feed
