23095052321715661284394680

  Stone Mountain Capital - Alternative Investment Advisory
  • About
    • Partners
    • Ventures
  • Team
    • Oliver Fochler
    • Ashvin Chotai
    • Pascal Hasler
    • Alexander Rothlin
    • Claudio Calonder
    • Joaquin Abos
    • Alliances
  • Advisory
    • Corporate Finance
    • Solutions
    • Mandates
  • Research
    • Perspective Subscription
    • News
    • Awards
  • Contact
    • Privacy Policy
    • Anti-Bribery Policy
    • UK Stewardship Code
    • ESG Policy
    • Disclaimer
  • Login

ALTERNATIVE MARKETS UPDATE Q3 2020 - MACRO OUTLOOK BY AQUILA MARKETS

23/10/2020

 
Alternatives Market Update October 2020

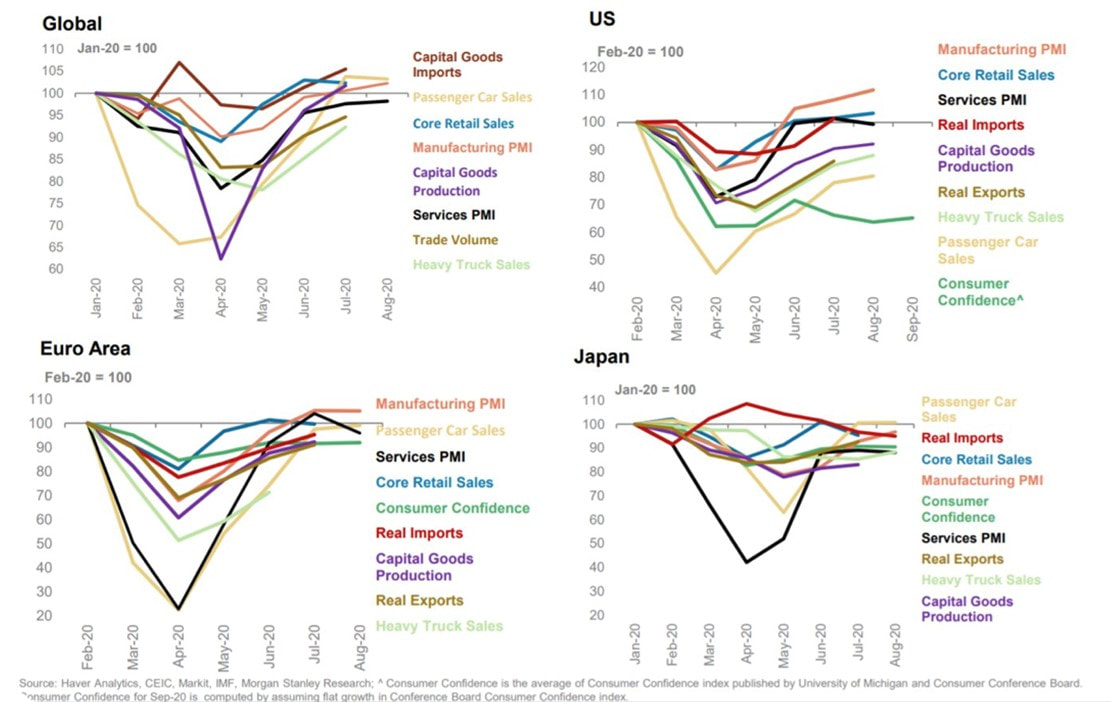
The coronavirus has hit the world severely in 2020. Europe, which had the virus under control in summer, has seen a huge surge in daily cases among almost countries. Some countries, such as Ireland, have already reacted with measures that are close to a lockdown which many countries have experienced in March and April 2020. Stock prices, especially in the US, have risen to record levels, due to the money printing of central banks, all above the Fed. However, at the end of Q3 2020, stocks have not continued their bull run after the crash and have started to decline. Especially tech stocks, which were undeniably the winners of the crisis, have experienced a decline. Nevertheless, the drawdowns now are in no comparison of the gains realized throughout the crisis. The developments observed in the stock market also apply partly to the macroeconomic indicators of recovery, as shown in Figure 1. It shows that the economy globally as well as the US are recovering, whereas Europe and Japan are moving flat. ​
Picture
Figure 1: Economic Indicators by Country, Source: Andrews Gwynne, Haver Analytics, CEIC, IMF & Morgan Stanley Research, October 2020
Picture
Hedge Funds
​
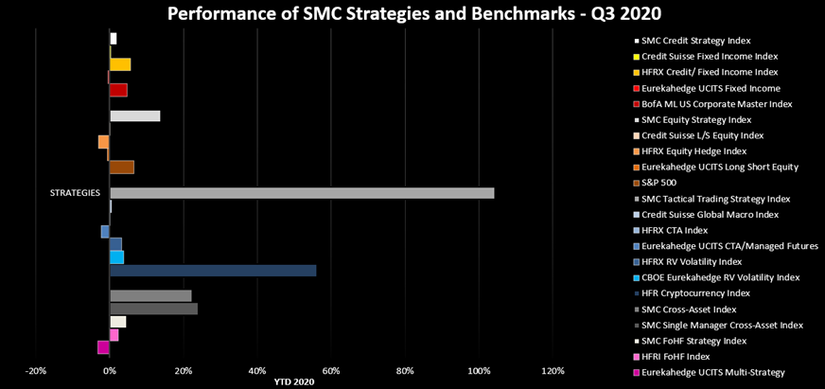
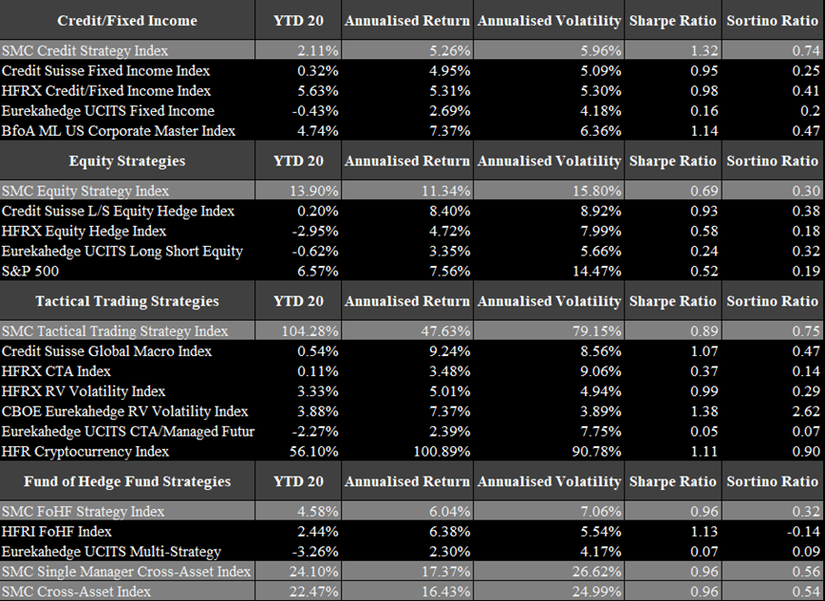
Figure 11 and 12 show our internal strategies compared to appropriate benchmarks. Our SMC Credit Strategy Index is up 2.11% as of September 2020. The SMC Equity Strategy Index has recovered quite well over the year and is up 13.90% with the most successful individual strategies being the Long/Short US Equities Disruptive Technologies strategy with a YTD of 48.20% and the Long/Short US Equity Consumer, TMT, Healthcare strategy with a YTD of 50.08%. Our SMC Tactical Trading Strategy Index is up 104.28% as of September, large based on various cryptocurrency-based strategies. These are further elaborated in the cryptocurrency section. Regarding individual strategies, the Discretionary Global Macro strategy did very well in 2020 with a YTD of 60.75%. The AuM of the hedge fund industry is at $3.22tn as of August 2020, according to Figure 13. The industry recovered quite well, as the AuM dropped way below $3tn during the year 2020, and it is now almost back at the level of $3.29tn, where it was at the end of 2019. The most common strategy (by AuM) is long/short equity, which accounts for 34% of the industry’s AuM. The next most common strategies are multi-strategy and CTA/managed futures but these strategies already account for a substantially lower percentage of the industry’s AuM. A further breakdown of strategy volume by AuM is shown in Figure 14.
Picture
Figure 11: SMC Indices and a Comparison of Benchmark Indices, Source: Stone Mountain Capital Research, October 2020
Picture
Figure 12: Summary Table of SMC Indices and a Comparison of Benchmark Indices, Source: Stone Mountain Capital Research, October 2020
*|MC_PREVIEW_TEXT|*
RESEARCH PERSPECTIVE VOL. 142
October 2020
Alternative Markets Update October 2020
The coronavirus has hit the world severely in 2020. Europe, which had the virus under control in summer, has seen a huge surge in daily cases among almost countries. Some countries, such as Ireland, have already reacted with measures that are close to a lockdown which many countries have experienced in March and April 2020. Stock prices, especially in the US, have risen to record levels, due to the money printing of central banks, all above the Fed. However, at the end of Q3 2020, stocks have not continued their bull run after the crash and have started to decline. Especially tech stocks, which were undeniably the winners of the crisis, have experienced a decline. Nevertheless, the drawdowns now are in no comparison of the gains realized throughout the crisis. The developments observed in the stock market also apply partly to the macroeconomic indicators of recovery, as shown in Figure 1. It shows that the economy globally as well as the US are recovering, whereas Europe and Japan are moving flat. The results of the stock market were largely caused by the intervention of the central banks. Figure 2 shows the federal debt held by the public from 1900 up to 2050. Now, we are on similar highs that were reached only in WW2 and the projection going forward looks even worse. Another channel of the central banks are asset purchases, which have also skyrocketed, especially for the Bank of Canada. Figure 3 shows the YoY-growth of the central bank’s assets. Most central banks only reach the levels from the global financial crisis (GFC) in 2008, which seems to be high, but these values tend to be low for the crisis we are facing currently. Many other channels, such as money printing have been used to such a high extent that is not nearly comparable with GFC in 2008. This development has put gold more in the focus, due its property of value storage. Gold was rising since summer 2019 and the gains were increased by the reaction of governments to print huge amounts of money. Q3 was a very good time for gold, as its price per ounce has risen from approximately $1740 to $2070 at its peak in early August, which is also a record high. Since then, the gold price has declined and remained relatively stable at the $1900 mark, as shown in Figure 4. As the measures taken to mitigate the effect of the crisis on the economy are likely to have consequences for at least several years, gold’s target price is a lot higher than where it is currently. Many targets estimate a value of $3,000 per ounce. Figure 5 shows a probability distribution for estimated gold values in 2030. The most likely scenario is gold being worth between $4,000 and $5,000 per ounce. Another commodity that did not do well in the crisis is oil. At the beginning of the crisis, oil experienced many unprecedented events, such as continuously hitting lower prices with the peak in April, during which the futures went negative. Figure 6 shows the price development of crude oil in the last year. Since its negative price, it has recovered quite well, also due to production cuts of the OPEC+. In Q3, the crude oil price remains very stable at $40 per barrel. Nevertheless, the outlook for the industry does not look good even when not considering that use of oil will start to decrease going forward. Figure 7 shows the OPEC’s demand estimate for barrels of crude oil. The projection is getting worse every month.
Figure 1: Economic Indicators by Country, Source: Andrews Gwynne, Haver Analytics, CEIC, IMF & Morgan Stanley Research, October 2020
Figure 2: Federal Debt Held by the Public from 1990 until 2050 (Projection) in Percentage of GDP, Source: Andrews Gwynne, October 2020
Figure 3: Central Bank Asset Growth – Balance Sheet Assets to Nominal GDP YoY Growth, Source: Andrews Gwynne, Bloomberg & Crescat Capital LLC, October 2020
Figure 4: Gold Price in USD per Ounce During the Last Year, Source: Gold Price, October 2020
Figure 5: Approximated Gold Price in 2030 by Probability Distribution in USD, Source: Andrews Gwynne & Incrementum, October 2020
Figure 6: Crude Oil Price Development During the Last Year, Source: Trading Economics, October 2020
Figure 7: OPEC’s Assessment of Global Crude Oil Demand until Q4 2021 (in million barrels a day), Source: Andrews Gwynne, October 2020
Hedge Funds
The year was not easy for hedge funds. The results achieved this year were mostly determined by the strategy a hedge fund pursued. Figure 8 shows the comparison of hedge fund returns over the last few quarters and years. The graph shows that the industry did what it was supposed to do. The industry managed to reduce the drawdown in Q1 2020 quite well with only -10%, whereas the S&P 500 was down 20%. Nevertheless, as expected, hedge funds did not bounce back as fast as most equity indices did. In sum, hedge funds performed worse in the last year, despite the relatively low drawdown at the beginning of the crisis. Hedge funds have been out of favour for many investors, due to the performance of the last few years and their continuous underperformance compared to equity indices. However, as hedge fund delivered their expectation in the crisis by mitigating the downside risk, investors are more attracted to hedge funds than they have been before. Figure 9 shows the investor sentiment to alternative asset classes with hedge funds topping the investor interest. Despite the positive reaction from investors to the hedge fund industry, the crisis also had a substantial impact on the industry. Figure 10 shows the number of fund launches and closures since 2008. Since 2016, there have been constantly more closures than launches and due to impact of Covid-19, this has not changed. Regarding trends during the crisis, it has been observed that trends have accelerated, which is also true for the hedge fund launches and closures. Although, the number of closures seems to be decreasing from 2019. However, the number of launches has decreased strongly. In 2020, there have been approximately only half as many launches as in 2018, which was the worst year in the last twelve years by number of launches. Nevertheless, this development is not surprising, as launching a fund during a crisis is typically not something that is done frequently except for funds that specifically focus on the impacts of the crisis. Figure 11 and 12 show our internal strategies compared to appropriate benchmarks. Our SMC Credit Strategy Index is up 2.11% as of September 2020. The SMC Equity Strategy Index has recovered quite well over the year and is up 13.90% with the most successful individual strategies being the Long/Short US Equities Disruptive Technologies strategy with a YTD of 48.20% and the Long/Short US Equity Consumer, TMT, Healthcare strategy with a YTD of 50.08%. Our SMC Tactical Trading Strategy Index is up 104.28% as of September, large based on various cryptocurrency-based strategies. These are further elaborated in the cryptocurrency section. Regarding individual strategies, the Discretionary Global Macro strategy did very well in 2020 with a YTD of 60.75%. The AuM of the hedge fund industry is at $3.22tn as of August 2020, according to Figure 13. The industry recovered quite well, as the AuM dropped way below $3tn during the year 2020, and it is now almost back at the level of $3.29tn, where it was at the end of 2019. The most common strategy (by AuM) is long/short equity, which accounts for 34% of the industry’s AuM. The next most common strategies are multi-strategy and CTA/managed futures but these strategies already account for a substantially lower percentage of the industry’s AuM. A further breakdown of strategy volume by AuM is shown in Figure 14.
Figure 8: Performance of Hedge Funds in Comparison to the S&P 500 PR Index, Source: Preqin, October 2020
Figure 9: Investor Sentiment Towards Alternative Asset Classes, Source: HFM, October 2020
Figure 10: Number of Fund Launches and Closures, Source: Eurekahedge, October 2020
Figure 11: SMC Indices and a Comparison of Benchmark Indices, Source: Stone Mountain Capital Research, October 2020
Figure 12: Summary Table of SMC Indices and a Comparison of Benchmark Indices, Source: Stone Mountain Capital Research, October 2020
Figure 13: AuM of the Hedge Fund Industry Split by Geography, Source: HFM, October 2020
Figure 14: AuM of Hedge Funds Split Among Strategies in Percentages, Source: Eurekahedge, October 2020
Cryptocurrencies / Blockchain
Cryptocurrencies had a fantastic year so far, further boosted by the fact that their price at the beginning was relatively low compared to the last two years. They also suffered substantially at the beginning of the crisis but have developed extremely ever since. Towards the end of Q2 2020, Bitcoin (BTC) just reached the $10k mark. However, since the beginning of Q3, cryptocurrencies have been stable. BTC for example remained steadily between $10,000 and $12,000 with a few times falling out of this interval. On 21st October 2020, BTC managed to raise to above $12,000 and due to Paypal’s announcement that it supports and allows for payments with its merchants, BTC rose to above $13,000 on 22nd October 2020. Currently, it is trading at $13,136. Figure 15 shows the development of BTC during 2020 (as of 22nd October 2020). BTC has achieved an outstanding YTD of 78.58% in 2020. The market capitalization of BTC has reached $238bn and is at its record value in 2020. Some cryptocurrencies have outperformed BTC substantially with Ethereum (ETH) being the most well-known among them with a staggering YTD of 215.54%. ETH started the year at $130.47 and is trading at $419 on 22nd October 2020. While BTC is almost at its record level in 2020, ETH has been significantly higher this year already, peaking at $470.70. Figure 16 shows the development of ETH during 2020 and it further emphasizes its relative strength compared to BTC (orange line). The market capitalization of ETH has reached a level of $46bn. The surge of cryptocurrencies is likely caused by the implications of the financial aids from governments as a reaction of the Covid crisis. On the one hand, cryptocurrencies became more interesting, due to their limited supply in comparison to the unprecedented money printing of many central banks around the world. Its purpose in this situation is store of value. On the other hand, it is frequently associated with gold’s similar usage. It is likely that cryptocurrencies have further benefited from this linkage to an asset that performed very well in comparison to most other assets. Furthermore, the outlook for the industry is bright, as many well-recognized investors and funds expect cryptocurrencies to rise a lot more. There are multiple of target prices of more than $200k for BTC. For example, former Goldman Sachs hedge fund chief expects BTC to raise above $1m in five years. Moreover, if BTC behaves similarly as it did on previous halvenings, it takes between half a year and a bit more than a year to substantially increase in value. This would imply a valuation of around $100k is possibly less than a year. A major reason why some cryptocurrencies have outperformed BTC tremendously (such as ETH) is decentralized finance (DeFi). Figure 17 shows the tremendous growth of DeFi in 2020. It started in 2020 with having less than $1bn locked in DeFi and rose to above $11bn. This huge growth caused ETH to increase even more, as a report showed that 96% of all DeFi-related application are based on ETH. Our cryptocurrency strategy profited accordingly to these developments in the markets. The Token strategy is up 194.40% in 2020, the Digital Asset Discretionary / Systematic Long/Short strategy is also up 109.00% and the Bitcoin Altcoin Actively Managed is up 52.97%. These performances are as of the end of September 2020.
Figure 15: Price and Market Capitalization of Bitcoin in 2020, Source: CoinMarketCap, October 2020
Figure 16: Price and Market Capitalization of Ethereum in 2020, Source: CoinMarketCap, October 2020
Figure 17: Development of Total Value Locked in DeFi During the Last Year (Cumulative), Source: DeFi Pulse, October 2020
Private Equity / Venture Capital
The private equity industry suffered through the crisis, but the impact was less severe than in other alternative industries. Fundraising in private equity declined substantially from Q4 2019 with more than $200bn raised but compared to the respective quarters the numbers do not look that bad. Figure 18 shows the aggregate capital raised in the last six years. In Q1 2020, approximately $150bn were raised with a bit less than 400 funds seeking capital. The capital raised is even higher than in Q1 2019 but there were slightly more funds raising capital in 2019. In Q2 and Q3 2020, the picture looks a bit different, especially the number of funds raising has dramatically decreased with only 200 funds raising in Q3 2020, whereas throughout Q1-Q3 2019, there were typically more than 400 funds raising capital. The capital raised in Q2 and Q3 2020 has decreased to $125bn per quarter, whereas Q2 and Q3 2019 raised about $175bn during this time. The AuM of the industry has slightly suffered at the beginning of the crisis, as shown in Figure 19. The AuM of the industry is at $4.43tn (as of March 2020). The dry powder of the industry accounts for a bit more than a third of the entire capital in the industry. The decline in fundraising as well as the rising dry powder can be partly explained by the transition from traditional deal making to virtual deal making, which is likely to slow down the process of both sides. In contrast to the other alternative industries, the attractiveness of the strategies has barely shifted at all, as shown in Figure 20. Lastly, venture capital is looked at a bit more detailed. Venture capital has done extremely well considering the economic circumstances, especially considering that the transition to virtual deal making probably has a more severe impact on than on regular private equity. Figure 21 shows the number of deals and the aggregate value of deals in the venture capital space. It was declining since its high Q2 2018 with almost $85bn. Throughout 2019, the sub-sector was raising about $60bn quarterly. In Q1 2020, the number fell slightly, whereas it increased slightly in Q2. However, Q3 2020 was a huge jump to $84bn. The industry has seen a slight change, as the number of funds raising has declined, suggesting a consolidation, which is in line with general market observations.
Figure 18: Global Quarterly Private Equity Fundraising from Q1 2015 to Q3 2020, Source: Preqin, October 2020
Figure 19: AuM and Dry Powder of Private Equity Funds from 2009 to 2020, Source: Preqin, October 2020
Figure 20: Strategies Targeted by Private Equity Investors over the Next 12 Months, Source: Preqin, October 2020
Figure 21: Quarterly Venture Capital Deals from Q1 2015 to Q3 2020, Source: Preqin, October 2020
Private Debt
The private debt market suffered as any other private asset class. New investors have experienced difficulty in committing to new funds or have reduced their investments, to profit from the recovery period in other asset classes. Despite the severe short-term impact, the number of funds and the aggregate capital are at record levels, as shown in Figure 22. The growth in 2020 in the industry as a whole has reached new record levels, the number of funds rose from 436 in January 2020 to 521 October 2020. Even more impressive, the aggregate capital rose from $192bn in January 2020 to $295bn October 2020. As a reaction to Covid-19 and the tendency to accelerate trends, big fund managers leverage their position to launch new funds with significant commitments. This is furthermore boosted by the demand from investors to mostly commit to one single private debt fund. Within the asset class, the short-term performance was weak, particularly the higher-risk strategies have not paid off so far. Figure 23 shows the strategies that investors are attracted to in Q3 2020 compared to Q3 2019. Private Debt Fund of Fund strategies have lost a lot of interest from investors, due to reasons mentioned above. Direct Lending is the second strategy that has had experienced lower demand investors; however, the strategy is still one of the major strategies within the industry. Unsurprisingly, the demand for special situation funds has doubled within the last year. Other strategies that have experienced a slight increase in interest are subordinated / mezzanine debt and distressed debt. In fundraising, the picture looks a bit different. Figure 24 shows the fundraising by strategy. Senior debt and subordinated debt account for the large portion of fundraising. Subordinated debt increased substantially compared to previous years, mostly at the expense of distressed debt. Lastly, Figure 25 shows the fundraising of private debt in absolute numbers. Despite being at a record level of capital and number of funds, the fundraising slowed down tremendously in Q3 2020 with only 20 funds closed and $8.4bn raised capital. However, Q2 2020 did fairly well with 60 funds closed and almost raising $40bn.
Figure 22: Private Debt Fund Market from January 2015 to October 2020, Source: Preqin, October 2020
Figure 23: Strategies Targeted by Private Debt Investors in the Next 12 Months, Source: Preqin, October 2020
Figure 24: Breakdown of Fundraising by Strategy from 2015 to Q3 2020, Source: Private Debt Investor, October 2020
Figure 25: Global Quarterly Private Debt Fundraising from Q1 2015 to Q3 2020, Source: Preqin, October 2020
Real Estate
The real estate industry was hit severely by the crisis, some sectors have faced or are still facing existential problems, predominately tourism-related property such as hotels. The fact that Covid-19 is spreading like wildfire in Europe again since early September certainly causes issues for tourism-related property, especially considering that there is a chance for new lockdowns in Europe, such as Ireland (at least to some degree) or the ban on going out in Paris after 9pm. This may also cause further issues for offices and retail property, even though, for the case of offices, they have been used sparsely during the entire year. All real estate sub-sectors have experienced a dramatic fall in transaction activity, whereas only a few sub-sectors have been hit heavily by price adjustments, such as hotels and retail. In some cases, as well offices but this is geography dependent. Figure 26 shows the fundraising in the private real estate industry. Q1 2020 was about the same as in Q1 2019 with regards to the number of funds closed but $20bn less raised. In Q2 2020 it seemed that economy is recovering, and the raised capital rose to about $45bn, despite the number of funds raising capital fell to lowest level since 2015. However, Q3 2020 looked very grim, as there were only about 20 funds raising capital, whereas in Q3 2019 about 120 were raising capital. Furthermore, the raised capital fell to a record low with only $20bn, compared to $50bn in Q3 2019. As mentioned before, deal activity fell substantially throughout 2020, as shown in Figure 27. Since 2017, the number of deals has been steadily between 2,000 and 2,500 per quarter. Q1 2020 was only slightly lower, as Covid-19 really impacted the markets at the end of February, so there was a lot of time, when business continued as it has before. Q2 and Q3 2020 were about the same, the number of deals fell by than 50% compared to previous years, with only 1,000 transaction a quarter. Percentagewise, the exposure to different sub-sectors remained approximately the same. Despite all these unfavourable conditions, the industry is growing. Figure 28 shows the number of funds raising capital and the aggregate capital targeted. Surprisingly, both numbers in October 2020 exceed their values from January 2020. The growth of the industry has slightly decreased. The number of funds raising increased by almost 100 since January 2020 to 1,013 funds in October 2020. The aggregate capital also rose slightly from $281bn to $297bn from January to October 2020. The growth can be explained by the bad economic conditions in other markets that real estate poses an alternative to, such as the bond market, in which government bond yields are close to zero or even below zero. Real estate markets are attractive for the reason mentioned below and the pricing adjustment that has taken place. Therefore, investors are looking for higher-risk strategies, as shown in Figure 29. There was a major shift in almost all strategies compared to the investor demand in Q3 2019. The most notable change is that only 50% of investor are looking to commit to Core in the next 12 months, compared to 71% in Q3 2019. Contrarily, investors are looking more toward Value Added and Opportunistic strategies, which increased to 59% for Value Added and to 55% for Opportunistic compared to only around 40% in Q3 2019.
Figure 26: Global Quarterly Private Real Estate Fundraising from Q1 2015 to Q3 2020, Source: Preqin, October 2020
Figure 27: Quarterly Global Private Equity Real Estate (PERE) Deals by Property Type, Source: Preqin, October 2020
Figure 28: Global Private Real Estate Funds in Market from January 2016 to October 2020, Source: Preqin, October 2020
Figure 29: Comparison of Strategies Target by Private Real Estate Investors in Q3 2019 and Q3 2020, Source: Preqin, October 2020
Looking forward, we view equity rotation from growth to value, pickup in inflation, and an increase in domestic focus by China as key themes into 2021. By Aquila Markets
As we enter the last four weeks of the US election campaign, we remain focused around our core short-term themes:
- Asset price manipulation from the US administration over for as long as they can manage it! (note the extraordinary line from former WH Chief of Staff Mick Mulvaney on Friday, when he stated that they “needed to put Kudlow on TV…. When we needed the markets to go up.”).
- Autumn volatility – we are seeing a basing in the vol measures we watch closely, from backend FX vol off a very low base (which presents terrific risk reward opportunities for 2021), both VIX and VXTLT (long bond ETF vol measure), as we believe short term gamma will perform well given the potential for not just a congested election in the US but myriad of other risk events.
- Deadline for Brexit resolution at the European council meeting on 15/16 Oct with both sides still, apparently, far away. There is an underlying expectation that the 11th hour solution will be found, but the risk of this NOT happening feels under-priced. The underlying risks of the combination of a non-deal Brexit and COVID hit to the economy are staggering, especially given the increasingly poorly received performance of Boris Johnson.
- Further lockdowns of various severity will hit Western nations and India. Meanwhile, China and South East Asian nations are much more advanced in managing real life alongside the pandemic whilst a vaccine regime (not a single vaccine!) is awaited.
 
In short – I believe we are still in a period where markets continue to be trapped by old narratives of growth outperformance relative to value, and US equity outperformance relative to rest of the world. Our dashboards continue to highlight the range bound nature of many markets, and a look at the RSI’s show no signs of technical stress anywhere. Yet, we know that positioning in many markets – long Tech stocks, extreme USD shorts, Gold and Silver overweights is at extremes. Our experience tells us this is not sustainable, and that volatility will reassert not just through the remainder of 2020, but into 2021 too.
 
Increasingly, we are focusing on the following themes to define 2021:
Democratic Sweep and change in US political stance:
- The chance of a Democrat sweep is growing. This will open the floodgates for both increased fiscal stimulus but also vast increased spending on healthcare, funded by higher taxes. At the margin this should be inflationary, which will put pressure on backend US yields to rise, steepening the yield curve. It would be surprising if Biden wanted to resist higher rates given the financial repression of keeping rates low has tipped the relative cost of capital vs labour firmly in the favour of capital. This will bring down the valuation of US real estate as well as causing significant rebalancing of US equity valuations away from Growth to Value. That chart (which we show again below and is a favourite) has all the characteristics of a bubble chart inflated over many years. Let us recall the relative performance of the FAANG relative to remainder of S&P495 as continuing to highlight the narrowness of real valuations. A Biden presidency is likely to be tougher on the Anti-trust investigations into US Big Tech, a risk we have been highlighting for many months.
- There is a narrative that Biden will be tougher on fossil fuels. That is likely to BULLISH for prices, not negative. Given our underlying narrative of “rotation to inflation”, we continue to view a sustained period of higher Oil prices as a major risk.
TRADE IMPLICATION: Rotation from growth to value stocks will cause a long-term top in US equity Indices. US Curve Steepening which can filter through to the rest of the world if the US is able to “export inflation”. Higher and persistent Oil prices.
 
US (plus the West) relationship with China: 
- A Biden presidency is likely to be more effective on the China rebalancing, utilising the full power of the US government rather than the Trump policy of creating a “fake” trade war to make a deal that China has completely fail to adhere to in anyway. But we need to look at this from the point of view of China, too. China has been extremely active during the pandemic, in terms of securing multi-year energy supplies in their relationship with Russia, aggressively resolving the HK issue, engaging in increased tensions with the Indians to name a few. But what has been missed by many is a diktak announced on 17th September by President Xi which ushers in much stricter control of private businesses by the Chinese Communist Party. All firms (large and small) will need to have a certain number of CCP registered employees, to ensure compliance with policies and centralised “reporting”.
Not only does this run the risk of Chinese companies being shut out of access to Western markets, it may be the case that this is WHAT CHINA WANTS. After all, it will defacto harm Western interests in China and allow tit for tat removal of Western influences, but it acts to potentially speed up China-Western decoupling. I heard a recent interview with a former senior UK intelligence official, who said the prevailing wisdom of Western Intelligence through the 80/90’s was China would become “more western” in outlook. Not only has this not happened, but under Xi the core rationale for decision making has been the strengthening and cementing of the Chinese Communist Party in power. The virus could provide China with a perfect opportunity to accelerate that strengthening domestically and in its local geography in the South China Sea and Western Pacific.
If a breakdown between China and the West is to come which will strengthen the omnipotence of the CCP within domestic China, then China driving the agenda of that breakdown would make sense. In this case, China has a clear and primary goal – the reassimilation of Taiwan into its full sphere of influence. The importance of this as a geopolitical risk CANNOT be overstated, in my view, especially against the backdrop of a Western military alliance weakened by funding disagreements as well as the virus. A new US President could be reluctant to see a full-blown military conflict with Taiwan. Not only is Taiwan seen as important for China’s prestige, but the power of its technology sector would be a great asset to China given its impending lockout from Western technological markets.
 
Inflation rotation in the US from asset prices to the real economy:
This has been a narrative we have discussed many times before, using the videos from 05th July and 29th September to highlight the correlation between velocity of money (low) and rise in M2 itself. Chart once again shown below. A significant change in policy in the US to drive the rotation out of growth into value discussed above is likely to create an overall fall in US equity markets which WILL have a negative effect on the US consumer as a whole especially if in conjunction with high backend US rates which will push all mortgage rates. The US is leveraged to low BACKEND rates and allows poor companies to remain solvent, whilst driving speculative USD to chase multiple expansion as the obsession for investors becomes growth. At the core, this will harm the simple “risk parity” narrative of a 60-40 portfolio (equity percentage relative to bonds); if BOTH assets go lower the pain will be felt as USD are withdrawn from being hoarded in financial assets and back into the real economy.
The reaction of the Fed in this rotation would be interesting, given it could create a huge dilemma for them. Being able to control back end rates, whilst clearly attempting to juice inflation expectations by buying TIPS at a rate in excess of the rate of overall balance sheet expansion, is a core of their game plan. Under that plan, investors are supposed to “buy the dip” in everything until we reach some magical halcyon point, when the Fed will say – we need to start hiking now and the market will gently and in a controlled way, rebalance itself to reflect the new equilibrium. Does that sound possible to you? Not to us either…. Central banks generally I sense will prefer QE over negative rates but will do a LOT of QE.
 
So these thematic thoughts sum up into the following longer term trade plays for 2021: 
- Higher US backend rates (potentially higher backend EURO rates) BUT long dated Japanese rates to remain close to 0.
- Higher overall vol bases to remain through Q4 and into 2021.
- Rotation from growth to value will mean a peaking in S&P500 index in the coming weeks / months, potentially a multi-year high.
- Significantly higher Oil and energy prices which will feed through too much higher equities valuations for both Oil Majors (XLE ETF) and Oil exploration companies (XOP ETF)
- With the risk of the JPY becoming the globe’s funding currency in an environment of higher backend US rates; USDJPY can trade higher. 1year USDJPY vol ATM is low at 7.5, but with a risk reversal heavily skewed for puts means the volatility for long dated USDJPY strikes offers strong risk reward. As a case in point, 04th June 112.50 USDJPY call costs 0.33 JPY pips off 105.57 spot ref, delta 11% but with a vol of 6.9. This level of implied volatility is extremely low.
- TLT – 20+year bond ETF is an asset we have used before and its volatility – VIX-TLT is on the Radar Screen…. And is ticking up. Downside plays on TLT we are increasingly viewing as core plays for 2021.
Figure 30: S&P500 Growth: Log Scale Shows Classic Bubble Acceleration, Source: Aquila Markets & Trading View, October 2020
Figure 31: Comparison of Velocity of M2 Money Stock and M2 Money Left, Source: Aquila Markets & Board of Governors, St. Louis Fed, October 2020
Figure 32: US Government Bonds 5Y Yield and U.S. Dollar Currency Index (Daily), Source: Aquila Markets & Trading View, October 2020
The views expressed in this article are those of the author and do not necessarily represent the views of, and should not be attributed to, Stone Mountain Capital LTD. Readers should refer to the Disclaimer.
 
Chris Eagle
Aquila Markets
E: chris.eagle@aquilamarkets.com
M: +447712885718
 
Chris is an experienced executive who runs his own consultancy service which focuses on business development, market structure, financial market analysis and training. He worked on the sell-side for twenty years. He left Jefferies in 2015, where he worked in the Global Foreign Exchange and was Head of FX product distribution.

For a subscription to Aquila Markets’ research after 2 week trial access
, click here.

This perspective is neither an offer to sell nor a solicitation of an offer to buy an interest in any investment or advisory service by Stone Mountain Capital LTD. For queries or for further information around our research and advisory services please contact email: research@stonemountain-capital.com under Tel.: +442037228175.
STONE MOUNTAIN CAPITAL
Stone Mountain Capital is an advisory boutique established in 2012 and headquartered in London with offices Pfaeffikon in Switzerland, Dubai and Umm Al Quwain in United Arab Emirates. We are advising 30+ best in class single hedge fund and multi-strategy managers across equity, credit, and tactical trading (global macro, CTAs and volatility). In private assets, we advise 10+ sponsors and general partners across private equity, venture capital, private credit, real estate, capital relief trades (CRT) by structuring funding vehicles, rating advisory and private placements. As of 7th July 2020, Stone Mountain Capital has total alternative Assets under Advisory (AuA) of US$ 56.1 billion. US$ 44.6 billion is mandated in hedge funds and US$ 11.5 billion in private assets and corporate finance (private equity, venture capital, private debt, real estate, fintech). Stone Mountain Capital has arranged new capital commitments of US$ 1.61 billion across hedge fund, private asset and corporate finance mandates and has been awarded over 40 industry awards for research, structuring and placement of alternative investments. As a socially responsible group, Stone Mountain Capital is a signatory to the UN Principles for Responsible Investing (PRI). Stone Mountain Capital applies Socially Responsible Investment (SRI) filters to all off its alternative investment strategies and general partners on behalf of investors. 
 
Our Team   Our Mandates   Our Research   Our News


Contact

We are able to source any specific alternative investment search and maintain relationships with dozens of best-in-class hedge fund managers, private equity and private debt general partners (GPs) and real estate and infrastructure developers. We don’t pass any costs on to our investors, since our compensation comes from our mandated managers, GPs and developers. Please contact us, should you require further information about our solutions.  

Twitter
LinkedIn
Facebook
Website
Email
Google Plus
Schedule a call with the team
Main UK Tel.: +44 207 268 4905
Main Switzerland Tel.: +41 44 586 45 55
Main UAE Tel.: +971 4383 5386
We have updated our privacy policy to take into account the new requirements of the GDPR. Please take some time to read the policy, which explains what personal data we collect, why we collect it, how we use it and other relevant information. You can review our privacy policy here, our anti-bribery policy here and our commitment to the UK stewardship code here. Stone Mountain Capital LTD is registered (Reference: ZA589246) in the data protection public register of the Information Commissioner's Office ('ICO') in the United Kingdom.

No action is required if you wish to remain in contact, however please reply if you want your details removed by contacting us at info@stonemountain-capital.com or by using the unsubscribe button below. In case this newsletter has been forwarded to you and you want to subscribe, please click here.

Stone Mountain Capital is a limited company (LTD) registered in England & Wales with registered number 8763463. The registered address is: One Mayfair Place, Devonshire House, Mayfair, London W1J 8AJ, England, United Kingdom. Stone Mountain Capital LTD is authorised and regulated with FRN: 929802 by the the Financial Conduct Authority (‘FCA’) in the United Kingdom. Stone Mountain Capital LTD is the Distributor of foreign collective investment schemes distributed to qualified investors in Switzerland. Certain of those foreign collective investment schemes are represented by First Independent Fund Services LTD, which is authorised and regulated by the Swiss Financial Market Supervisory Authority (‘FINMA') as Swiss Representative of foreign collective investment schemes pursuant to Art 13 para 2 let. h in the Federal Act on Collective Investment Schemes (CISA). Stone Mountain Capital LTD conducts securities related activities in the U.S. pursuant to a Securities and Exchange Commission ('SEC') Rule 15a-6 Agreement with Crito Capital LLC, a U.S. SEC registered broker-dealer, and member of Financial Industry Regulatory Authority (‘FINRA’), Securities Investor Protection Corporation (‘SIPC’) and Municipal Securities Rulemaking Board (‘MSRB'). Stone Mountain Capital Partners LLP is incorporated as limited liability partnership in England & Wales with company registration number: OC430515. Its registered office is: One Mayfair Place, Devonshire House, Mayfair, London W1J 8AJ, United Kingdom.  Stone Mountain Capital Partners LLP is registered as Appointed Representative with FRN: 934964 of Stone Mountain Capital LTD which is authorised and regulated with FRN: 929802 by the Financial Conduct Authority (‘FCA’) in the United Kingdom. Stone Mountain Capital FZE is registered at: Business Center, Al Shmookh Building, Umm Al Quwain Free Zone, Umm Al Quwain, United Arab Emirates. All information in this perspective including research is classified as minor acceptable non-monetary benefits ('MNMB') in accordance with article 11(5)(a) of the MiFID Delegated Directive (EU) 2017/593 and FCA COBS 2.3A.19.

Copyright © 2020 Stone Mountain Capital LTD. All rights reserved.
Any business communication, sent by or on behalf of Stone Mountain Capital LTD or one of its affiliated firms or other entities (together "Stone Mountain"), is confidential and may be privileged or otherwise protected. This e-mail message is for information purposes only, it is not a recommendation, advice, offer or solicitation to buy or sell a product or service nor an official confirmation of any transaction. It is directed at persons who are professionals and is not intended for retail customer use. This e-mail message and any attachments are for the sole use of the intended recipient(s). Our LTD accepts no liability for the content of this email, or for the consequences of any actions taken on the basis of the information provided, unless that information is subsequently confirmed in writing. Any views or opinions presented in this email are solely those of the author and do not necessarily represent those of the limited company. Any unauthorised review, use, disclosure or distribution is prohibited. If you are not the intended recipient, please notify the sender by reply e-mail and destroy all copies of the original message and any attachments. By replying to this e-mail, you consent to Stone Mountain monitoring the content of any e-mails you send to or receive from Stone Mountain. Stone Mountain is not liable for any opinions expressed by the sender where this is a non-business e-mail. Emails are not secure and cannot be guaranteed to be error free. Anyone who communicates with us by email is taken to accept these risks. This message is subject to our terms at our Disclaimer.
 

Comments are closed.
    British Pound Exchange Rate
    Tweets by @stonemountainuk
    Tweets by @stonemountainch
    Tweets by @stonemountainae
    Tweets by @stonemountaincp
    Tweets by @stonemountaincp
    Tweets by @OliverFochler
    Tweets by @ChotaiAshvin
    Tweets by @hasler_pascal


    ​Archives

    January 2023
    December 2022
    November 2022
    October 2022
    September 2022
    August 2022
    July 2022
    June 2022
    May 2022
    April 2022
    March 2022
    February 2022
    January 2022
    December 2021
    November 2021
    October 2021
    September 2021
    August 2021
    July 2021
    June 2021
    May 2021
    April 2021
    March 2021
    February 2021
    January 2021
    December 2020
    November 2020
    October 2020
    September 2020
    August 2020
    July 2020
    June 2020
    May 2020
    April 2020
    March 2020
    February 2020
    January 2020
    October 2019
    September 2019
    August 2019
    July 2019
    June 2019
    April 2019
    January 2019
    November 2018
    August 2018
    May 2018
    February 2018
    December 2017
    November 2017
    October 2017
    June 2017
    March 2017
    February 2017
    January 2017
    November 2016
    October 2016
    August 2016
    July 2016
    June 2016
    May 2016
    April 2016
    March 2016
    February 2016
    January 2016
    December 2015
    November 2015

    Categories

    All
    Bitcoin
    Blockchain
    China
    Corporate
    Credit
    Cryptocurrency
    CTA
    Direct Lending
    Emerging Markets
    Equity
    ETF
    Ethereum
    Fund Of Hedge Fund
    Global Macro
    Hedge Fund
    Index
    Middle Market
    Private Debt
    Private Equity
    Rating
    Real Estate
    Risk Premia
    SME
    State Owned Enterprise
    Stocks
    UCITS
    Venture Capital
    VIX
    Volatility
    VSTOXX

    RSS Feed

PRIVACY POLICY
ANTI-BRIBERY POLICY
UK STEWARDSHIP CODE
CONTACT
DISCLAIMER
ESG POLICY
Picture

​Stone Mountain Capital LTD is authorised and regulated with FRN: 929802 by the Financial Conduct Authority (‘FCA’) in the United Kingdom. 
The website content is neither an offer to sell nor a solicitation of an offer to buy an interest in any investment or advisory service by​
Stone Mountain Capital LTD and should be read with the DISCLAIMER.
© 2023 Stone Mountain Capital LTD. All rights reserved.
  • About
    • Partners
    • Ventures
  • Team
    • Oliver Fochler
    • Ashvin Chotai
    • Pascal Hasler
    • Alexander Rothlin
    • Claudio Calonder
    • Joaquin Abos
    • Alliances
  • Advisory
    • Corporate Finance
    • Solutions
    • Mandates
  • Research
    • Perspective Subscription
    • News
    • Awards
  • Contact
    • Privacy Policy
    • Anti-Bribery Policy
    • UK Stewardship Code
    • ESG Policy
    • Disclaimer
  • Login