
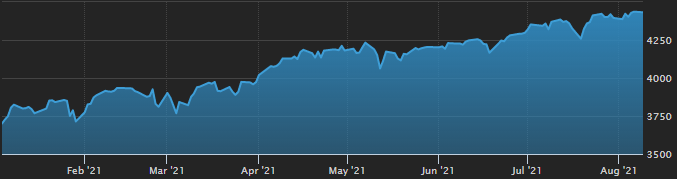
The macroeconomic environment will largely drive the market in H2 2021, which itself is based on significant degree how Covid-19 will evolve in the near future. With regards to the pandemic, the key questions are how the number of vaccinations evolve going forward, in particular as developed economies no longer have shortages of vaccines, but rather a declining number of people that want to get vaccinated. A crucial point is whether herd immunity can be achieved, either by being vaccinated or having had the virus. Another important point is how long the vaccine will last, as the cases of vaccinated people contracting the virus rises. Luckily, the symptoms seem to be minor. Probably even more important is whether new strains of the virus emerge that completely bypass vaccinations and essentially setting the world back to March 2020. The latter scenario seems less likely but should be considered to some degree. In a non-negative scenario, US inflation is likely to drop towards the end of the year with expectations around 3%. For the next years, it is expected that US inflation will remain between 2% and 3%, following the change in the FED’s inflation target of being 2% in the long-term instead of capping inflation at 2%. Thus, it is unlikely that inflation will drop below 2% for quite some time. In the EU, the inflation outlook is lower compared to the US, as the ECB expects inflation to rise to around 2.6% in Q4 2021. In 2022 and 2023, inflation is expected to remain around 1.5%. Furthermore, the FED and ECB also hinted at possibly putting more emphasis on employment instead of inflation going forward. This suggests gold being well positioned in the current market. As of July 2021, gold is almost back at its average in 2021 of $1800 per ounce. Despite being at a relatively high level historically, gold seems attractive with surging inflation and short-term interest rates being very close to 0%. Yet gold’s record high of more than $2000 per ounce lies back almost a year, at a point in which inflation was at 1% and not a concern for many. Since May 2021, inflows in gold ETFs are positive again albeit a bit sluggish. This is remarkable as previously, there were mostly only net outflows. Currently, the global gold AuM is at $214bn. Equities, in particular in the US, have experienced a great 2021, as shown in Figure 1. The S&P 500 is trading very close to its record high of around 4,450. During 2021, expectations for the S&P 500 level were adjusted multiple times. At the end of 2020, when the S&P 500 was 3,700, moderate expectations were around 3,900, while optimistic scenarios targeted 4,300. Yet, all those expectations were already surpassed in the low-interest rate environment, monetary stimulus and increased corporate earnings due to the recovery of the economy. Goldman Sachs has updated its target for the S&P 500 to 4,700 at the end of 2021. Contrarily, Chinese tech companies have suffered in July with the worst month since the financial crisis in 2008. Investors feared the crackdown of Chinese regulators on tech companies. Figure 2 shows valuations of Chinese companies listed in Hong Kong and in the US. Not only, are Chinese tech companies strongly undervalued compared to US tech stocks. Furthermore, Chinese tech companies listed in the US are even stronger undervalued, as very few even reach a multiple of 5, as shown in Figure 2.
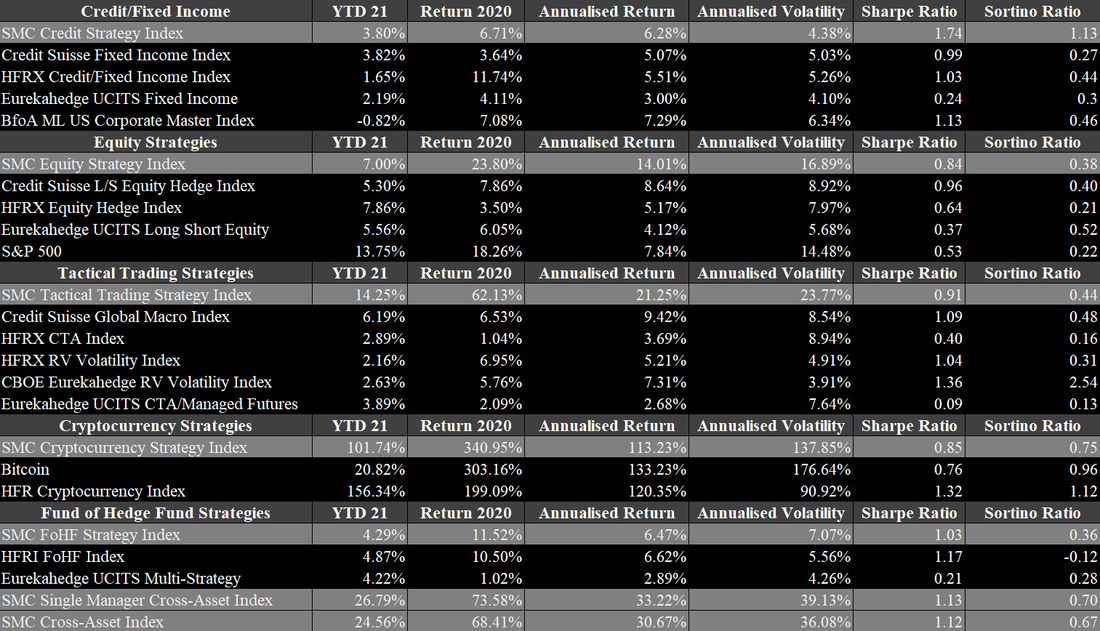
Hedge funds are doing very well currently. After having suffered substantial drawdowns in March 2020, they delivered what they promised to do. They were able to limit losses well, while profiting significantly from the subsequent upswing. This positioned hedge funds in a good light towards potential investors that previously stepped away from hedge funds or planned to, due to their frequent inability to generate excess returns in boom phases over the last few years. As the crisis was handled well by the industry, this perception significantly shifted. Preqin reported that the average return of hedge funds in 2020 was 16.69% and 12.73% as of June 2021, which are remarkable numbers for this environment. In particular, as some sectors and industries, such as fixed income, are struggling since Covid-19 emerged. Figures 9 to 14 provide a summary of our benchmark indices compared to other widely known benchmarks, based on fixed income, equity, tactical trading and fund of hedge funds strategies. Our two major benchmark indices, the SMC Single Manager Cross-Asset Index and the SMC Cross-Asset Index, are up 26.79% and 24.59% as of June 2021. Fixed Income strategies continue to struggle but managed to achieve solid one-digit returns over 2020 and 2021. The two most outstanding strategies in this asset class are European High Yield L/S Credit with a return of 13.37% in 2021 and Trade Finance Crypto with a YTD of 9.11%. The latter also has not experienced a single negative monthly return since its inception in January 2017. The performance of equity-based strategies in 2021 is 7%, while the individual strategies widely varied since 2020. On the one hand, Long/Short US Equity Consumer, TMT, Healthcare had a stellar return of 66% in 2020 but is stagnating in 2021 with a YTD of 0.13%. On the other hand, Equities US Activist Event Driven was up only 2.52% in 2020 but is up 30.68% in 2021 so far. Our SMC Tactical Trading Strategy Index is up 14% in 2021 and was up 62% in 2020. The global macro strategies deviate strongly from each other’s monthly returns. The Discretionary Global Macro strategy is up 26% in 2021, even though it suffered a loss of 18% in June 2021. In 2020, the strategy also achieved a return of 27%. The Systematic Global Macro strategy is up only 2% as of June 2021 but was up 97% in 2020. Unsurprisingly, the SMC Cryptocurrency Strategy Index had the best performance in both 2021 and 2020. In 2021, the index is up 101% and in 2020 340%. The crypto-based strategies range from Token Liquid with a YTD 2021 of 171% to Bitcoin that is up only 19.2% YTD 2021. Over the last two years, the Token strategy was the most successful one with being up 504% in 2020 and another 164% in 2021. Cryptocurrencies are further described in following section.
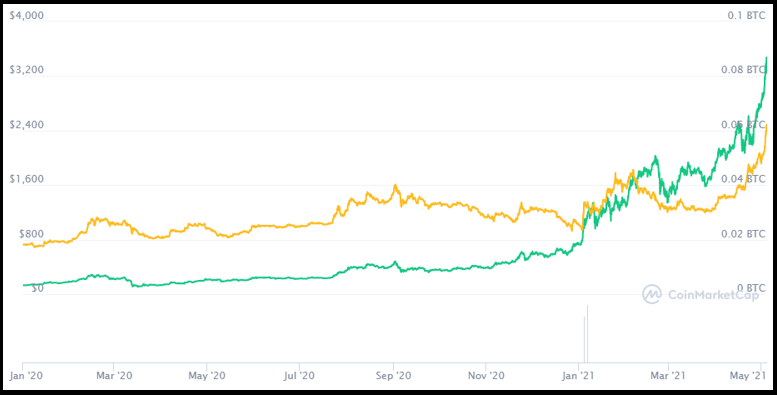
Hedge funds are doing great in 2021. Hedge funds’ AuM has surpassed the $3.8tn mark in March 2021, which is backed by several reasons. The more negative view on hedge funds over the last five years have subsided, since they have mitigated the financial impact of Covid-19 and posted strong performances afterwards. This boosted the AuM through the performance as well as additional inflows caused by the good results. This is very likely to continue, since hedge funds have had their best Q1 return for more than two decades. Alternative investments in general did very well. Private equity was slowed down initially by Covid-19, but their recovery returns were extremely strong. The high valuations on the stock market certainly helped to achieve this return. Private debt did well too, although their initial recovery was slower. But due to the favorable interest rates, private debt seems attractive compared to public debt. Commodities are doing well too, especially considering their relatively bad performance over the last decade. Gold gained significantly since 2019, which was further boosted by the money printing following Covid-19 and surged to a record of $2k per ounce, but since then, it lost again and has been very stable at around $1.7k over the last months. Oil, which was hit very hard during the initial Covid-19 reactions, has reached its level prior to the crisis and continues to reach higher prices. Just in the last month, WTI crude oil gained more than 10% and is currently at $66 per barrel. Industry metals also have gained substantially in 2021 and due to their demand, it is likely that this will continue. Cryptocurrencies have gained again over the last two weeks. Bitcoin (BTC) was not that specular, as remains between $50k and $60k, despite dropping quickly below the $50k mark. Nevertheless, BTC is still up 91% in 2021 and its market cap remains above $1tn. The big mover was Ethereum (ETH), which was around $2,500 before its surge starting in early May. It peaked above $3,400 and is currently at $3,350. ETH is up 349% in 2021 and almost has a market cap of $400bn. Figure 5 shows the ETH price (in green) from 2020 onwards and its value in BTC (yellow line). During 2020, the two coins moved similar, but since 2021, ETH is outperforming BTC substantially. At the end of 2020, ETH was worth less 0.03 BTC, whereas now it is worth more than 0.06 BTC per coin. Other altcoins followed ETH, but not to same extent. Thus, the crypto market, of which 70% was BTC in 2020, known as “Bitcoin dominance” is shrinking. Currently, BTC only accounts for 45% of the market capitalization of the crypto market.

Alternative Markets Update March 2021
In the current uncertainty in the markets, macroeconomic factors play an important role aside from Covid-19 and the vaccination efforts. Inflation is a major concern in 2021, even though it was very obvious in 2020 already. However, in 2020, it was completely overshadowed by Covid-19 and the tremendous surge in equity markets among others. Inflation is a concern around the world, caused by the severe interventions undertaken by central banks. In particular in the US, where the FED intervened with money printing on such a scale that it cannot be compared to any other economy. This was largely required, as conventional monetary policy was not enough, for example, lowering the interest rates to the area around 0%. Even quantitative easing could not solve the problem, even though the FED’s balance sheet ballooned. Figure 1 shows the FED’s balance sheet over the last five years. At the beginning of the crisis, the federal reserve was at around $4.3tn. In 2020, this increased by 76% to $7.3tn and is still rising in 2021. Currently, it is at almost $7.7tn. In comparison to 2008, during which the federal reserve increased by 151%, the balance sheet increased by “only” $1.3tn in absolute terms. It is important to note that during the last two decades, the FED’s balance never declined by more than 1% on an annual basis with one exception being 2018 with a decrease of 8%. Interest rates in the US have recovered quite spectacularly over the last months. Figure 2 shows the development of interest rates in major economies over the last few months. The US interest rates are higher than any other interest rate from the UK, Europe or Japan, both short- and long-term. The short-term interest rates have remained very stable, while the long-term rates have increased a lot, for example, the 10-y US treasury note is soon back at 2%. |
|
 RSS Feed

|
|
|
Stone Mountain Capital LTD is authorised and regulated with FRN: 929802 by the Financial Conduct Authority (‘FCA’) in the United Kingdom. The website content is neither an offer to sell nor a solicitation of an offer to buy an interest in any investment or advisory service by Stone Mountain Capital LTD and should be read with the DISCLAIMER. © 2024 Stone Mountain Capital LTD. All rights reserved. |